What is El Niño ?
The term El Niño (in Spanish "the boy" or by extension "the Christ Child") was originally used by fishermen of Ecuador and Peru to refer to above-normal sea surface temperatures that typically appear around Christmas time in the eastern Pacific Ocean in equatorial regions and last for several months. Due to the abnormal heating up of the waters, they saw all the fish disappear from the coasts every 2 to 7 years.
El Niño and La Niña are respectively the warm and cold phases of what is called El Niño Southern Oscillation (ENSO) cycle. These expressions of climatic variability result from a series of interactions between the atmosphere and the tropical ocean.
El Niño severely alters the normal weather patterns not only in the Eastern Pacific, but worldwide. It induces drought in areas that normally receive abundant rain and, conversely, heavy rainfall and floods in usually arid desert zones.
How Does El Niño Work?
In normal conditions, the winds blow from east to west across the waters of the tropical Pacific, pushing the surface waters towards Australia and New Guinea. The piling up of warm surface water causes a sea level rise in the western Pacific while, in the eastern, an "upwelling" of deeper and colder ocean waters brings with it the nutrients that otherwise would remain near the bottom and on which the fish populations living in the upper waters are dependent for survival.
During El Nino years, lower than normal pressure is observed over the eastern tropical Pacific and higher than normal pressure is found over Indonesia and northern Australia. This causes a weakening of the westerly winds, the ocean surface in eastern Pacific warms up (with sea level rise by up to 35 cm along the Pacific coast), the winds further weakens and El Niño strengthens. As a consequence, the upwelling of deep water ceases, with devastating impact on the fishing crops which rely on cool waters to thrive. The clouds and thunderstorms shift eastward along with warmer water, producing extremely higher than average amounts of rainfall along the equator. This also results in changes in jet streams (winds aloft), which lead to dry conditions in Indonesia and Australia.
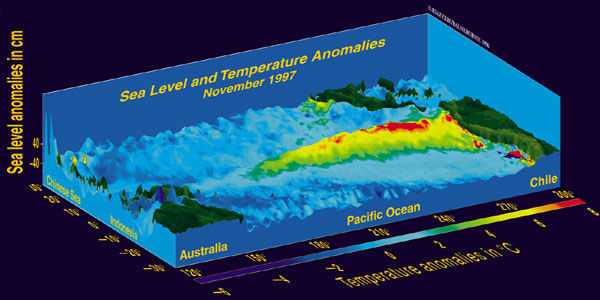
The 1997-98 El Niño, observed here by ESA's ERS-2 satellite, is one of the strongest this century, with increased rainfall
causing flooding in the USA andPeru, and drought in the western Pacific. The 3-D image shows the state of the Pacific in
November 1997,in terms of deviations from the 'normal' ocean - namely, height changes between -40 cm and +40 cm,
and temperature changes of -6ºC (blue) to 8ºC (red). A very good correlation between the sea surface temperature
and the height anomalies can be perceived - Source: Resources in Earth Observation - CEOS
Strong El Niños are thus often associated with flooding rains and warm weather in Peru, severe drought in Indonesia, Africa, Australia and parts of southern Asia, stronger winter storms over California and southern United States, with accompanying floods and landslides. Further, while El Niño is known to lower the probability of hurricanes in the Atlantic, it increases the chances of cyclones and typhoons in the Pacific.
La Niña on the other hand is characterized by lower than normal pressure over Indonesia and northern Australia and higher than normal pressure over the eastern tropical Pacific. This pressure pattern is associated with stronger easterly winds over the central and eastern equatorial Pacific.
As the periodicity of this phenomenon varies from 2 to 7 years and shows no regular pattern, El Niño is called a quasi-cyclic variation.
Record-breaking El Niño events
El Niño attained exceptionally large amplitudes on two occasions at the end of the 20th Century, in 1982-1983, and in 1997-1998. In 1982, up to 2.5 m of rain fell during a six-month period in Ecuador and northern Peru, transforming the coastal desert into a grassland dotted with lakes. Abnormal wind patterns also caused the monsoon rains to fall over the central Pacific instead of on the western edge, which led to droughts and disastrous forest fires in Indonesia and Australia. Overall, the loss to the global economy as a result of the El Niño amounted to more than $8 billion. The record-breaking El Niño event in the winter 1997-1998 has lead to severe weather events included flooding in the south-eastern United States, major storms in the Northeast, and flooding in California. Most of the disasters in 1998, including record floods in China and Bangladesh and Hurricane Mitch in Central America, were attributed to the El Niño or La Niña phenomena.
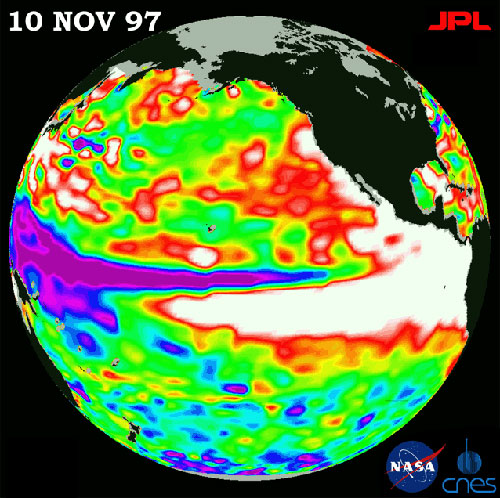
During an El Niño water temperatures in the Pacific Ocean may rise on average 3 - 5°C above average. Water expands as it gets warmer, and the lack of cold water dependent nutrients make it less dense. This expanded, less dense water results in a rise in sea level, observable from space. During the major 97-98 event, sea level peaked at 35 cm above average in the eastern Pacific, near the Galapagos Islands, and at 18 cm below normal near Australia, resulting in dramatic drop in fishing on the Pacific coast and in mass coral bleaching events around the world. This image of the Pacific Ocean was produced using sea surface height measurements taken by the U.S./French TOPEX/Poseidon satellite and shows sea surface height relative to normal ocean conditions on Nov. 10, 1997. The white and red areas indicate unusual patterns of heat storage; in the white areas, the sea surface is between 14 and 35 cm above normal; in the red areas, it is about 10 cm above normal. The green areas indicate normal conditions, while purple means at least 18 cm below normal sea level. The surface area covered by the warm water mass is about one-and-one-half times the size of the continental United States. The added amount of oceanic warm water near the Americas, with a temperature between 21- to- 30 °C, is about 30 times the volume of water in all the U.S. Great Lakes combined. The surplus heat associated with this water mass held 93 times the fossil fuel energy used by the U.S. during an entire year! - Source: NASA JPL Ocean Surface Topography
El Niño and Global Warming
El Niño events have become more frequent and have had greater climate impacts over the past century. Nevertheless scientists cannot say with certainty that the extreme intensity of the two events which occurred at the end of the 20th Century is linked to recent intensification of global warming. If that turned out to be the case, the El Nino phenomenon could become more and more intense and destructive, not only on the South American coasts, but also in other regions of the world.
Sources
AVISO (Archivage, Validation et Interprétation des données des Satellites Océanographiques)
El Niño, affecté par le réchauffement de la planète ? - Notre-Planète.info
El Niño affected by global warming - Terra Daily
El Niño Information - California Department of Fish and Game
El Nino - NASA Science
El Niño - Southern Oscillation - NOAA Climate Prediction Center
FAO Fisheries and Aquaculture Department
FAQs about El Niño and La Niña - NOAA Tropical Atmosphere Ocean Project
Our Affair with El Niño: How we transformed an enchanting peruvian current into a global climate hazard - Princeton University Press
Variabilités climatiques - CNES
Links
Sea level viewer (on the website Ocean Surface Topography From Space - NASA JPL)
El Niño Animations and Graphics
This page was written in 2009, as additional information to the poster series "10 years of Imaging the Earth"