Published on 26 January 2021
Earth’s global average surface temperature in 2020 tied with 2016 for the warmest year on record, according to an analysis by NASA.
Continuing the planet’s long-term warming trend, the globally averaged temperature in 2020 was 1.02 degrees Celsius warmer than the baseline 1951–1980 mean, according to scientists at NASA’s Goddard Institute for Space Studies (GISS). The year was slightly warmer than 2016 but within the margin of error of the analysis, making the years effectively tied.
GISS Director Gavin Schmidt
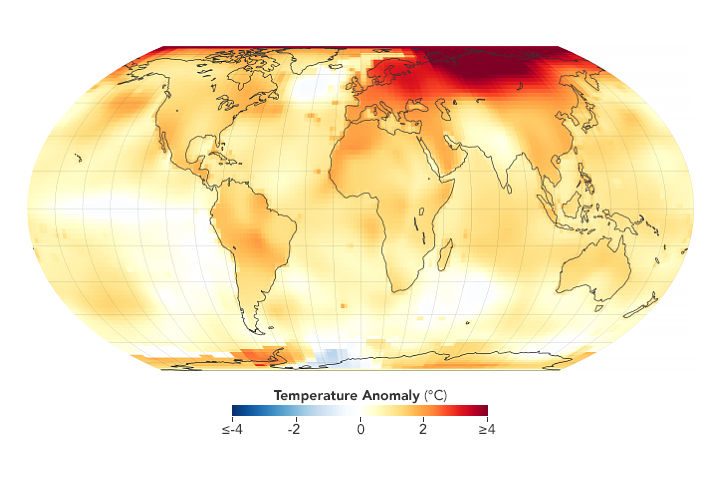
The map above depicts global temperature anomalies in 2020. It does not show absolute temperatures; instead, it shows how much warmer or cooler each region of Earth was compared to the baseline average from 1951 to 1980. The bar chart below shows this year in the context of the past 140 years in the modern temperature record. The values represent surface temperatures averaged over the entire globe for the year.
Tracking global temperature trends provides a critical indicator of the impact of human activities—specifically, greenhouse gas emissions—on our planet. Earth’s average temperature has risen more than 1.2 degrees Celsius (2 degrees Fahrenheit) since the late 19th century.
A separate, independent analysis by the National Oceanic and Atmospheric Administration (NOAA) concluded that 2020 was the second-warmest year in their record, behind 2016. NOAA scientists use much of the same raw temperature data in their analysis, but have a different baseline period (1901-2000) and methodology. They noted that 2020 was the 44th consecutive year with global land and ocean temperatures above the 20th-century average.
Scientists from Europe’s Copernicus program also have 2020 tying 2016 as the warmest year on record, while the UK Met Office ranked 2020 as the second-warmest.

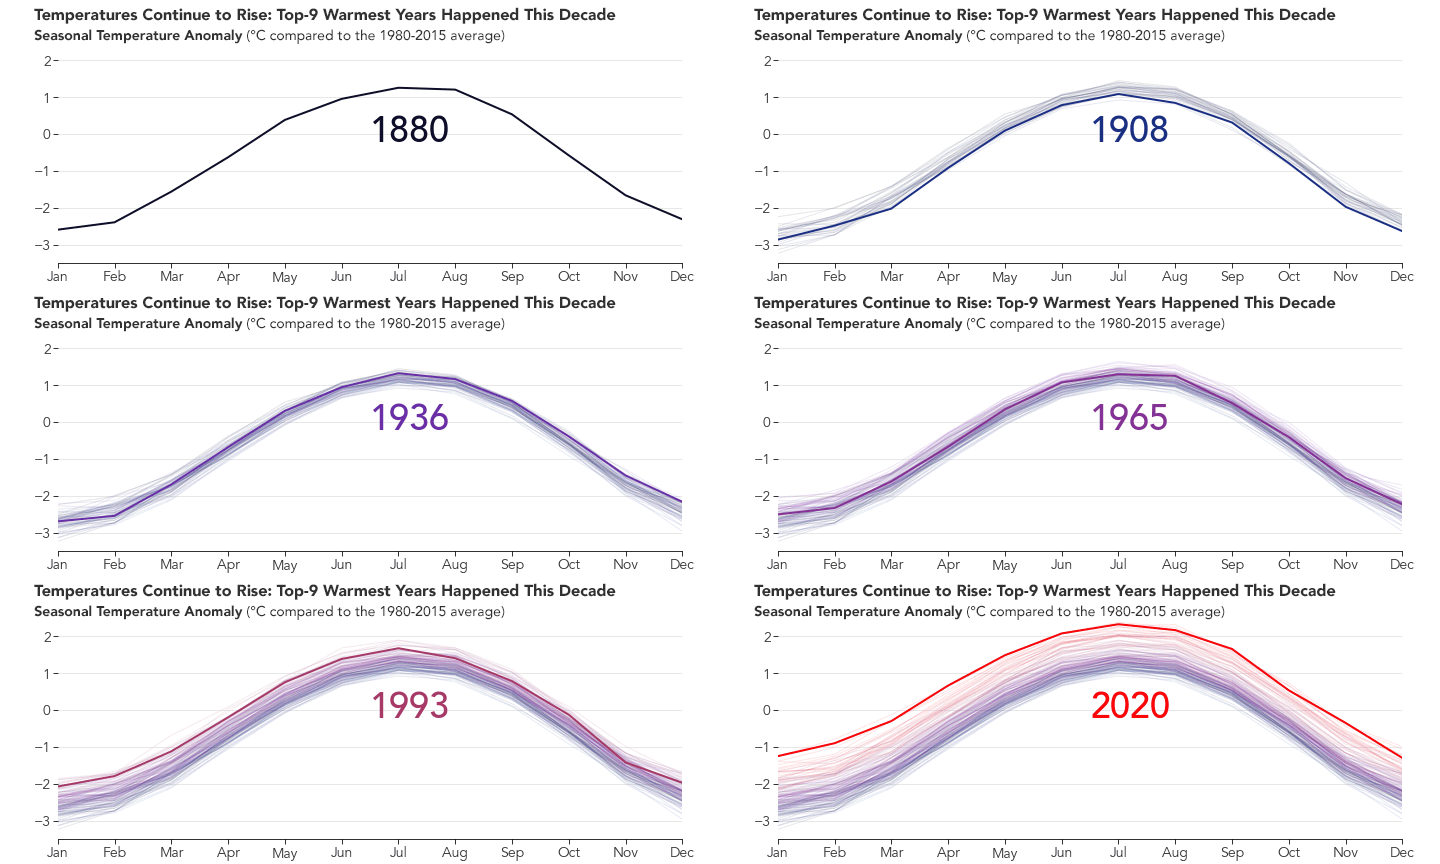
The animation above shows the seasonal cycle in global temperature anomalies for every month since 1880. Each line shows how much the global monthly temperature was above or below the global mean of 1980–2015. These seasonal anomalies are drawn from the Modern-Era Retrospective analysis for Research and Applications, version 2 (MERRA-2), a model run by NASA’s Global Modeling and Assimilation Office.
