Published on 6 August 2021
As ice sheets melted at the end of the last Ice Age, sea levels rose and an inland sea formed in New England and southeastern Canada. Whales swam in what is now central Vermont. Ten thousand years later, the atmosphere and oceans are warming rapidly and land ice at all latitudes is melting. Data collected by satellite altimeters over the past three decades show that global sea level has risen by an average of 3.4 millimeters per year and the rate is accelerating.
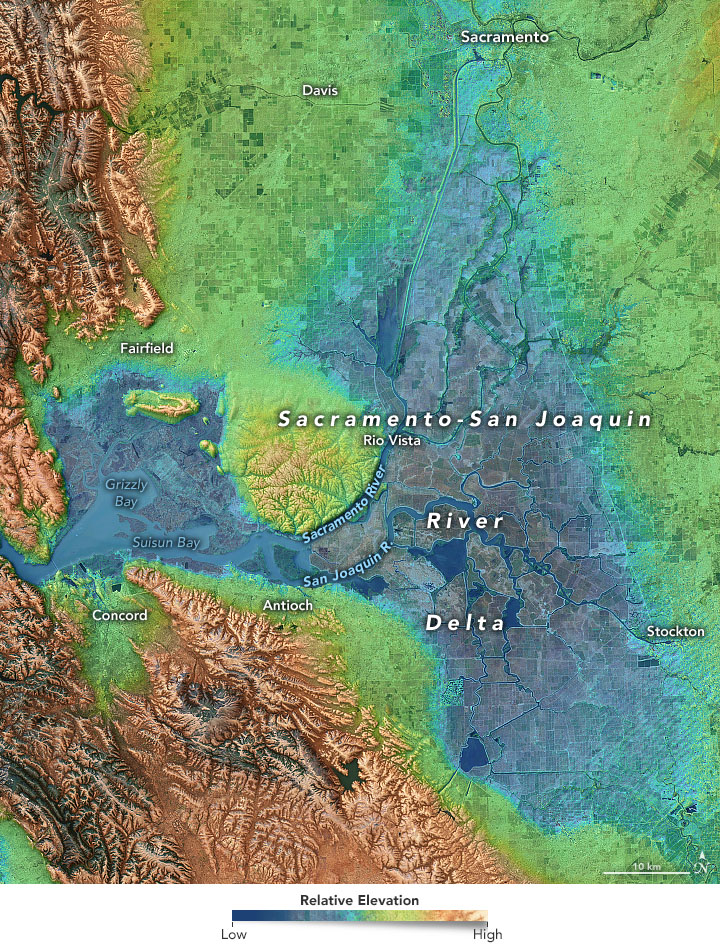
 The Landsat 8 image and digital elevation model above highlights the vast network of levees that protect islands within the Sacramento-San Joaquin Delta. Many of the islands lie as much as 15 meters below sea level and would already be underwater without the levees. In the map, the lower elevation areas are shown in blue; higher elevation areas are green and brown.
As global warming changes our planet, which coastlines are most and least vulnerable to sea level rise? Could new inland seas and waterways develop as they did thousands of years ago? Could Lake Champlain ever reconnect to the ocean and become the Champlain Sea again?
These are the types of questions that members of NASA’s sea level rise team work on. Through a series of individual research projects and collective consultation, scientists are deciphering clues about past sea level rise, gathering observations of present conditions from satellites, ships, and airplanes, and developing computer models to anticipate possible futures. While definitive answers about local sea levels remain a challenge, decades of research have made the global picture much clearer.