Published on 8 November 2022
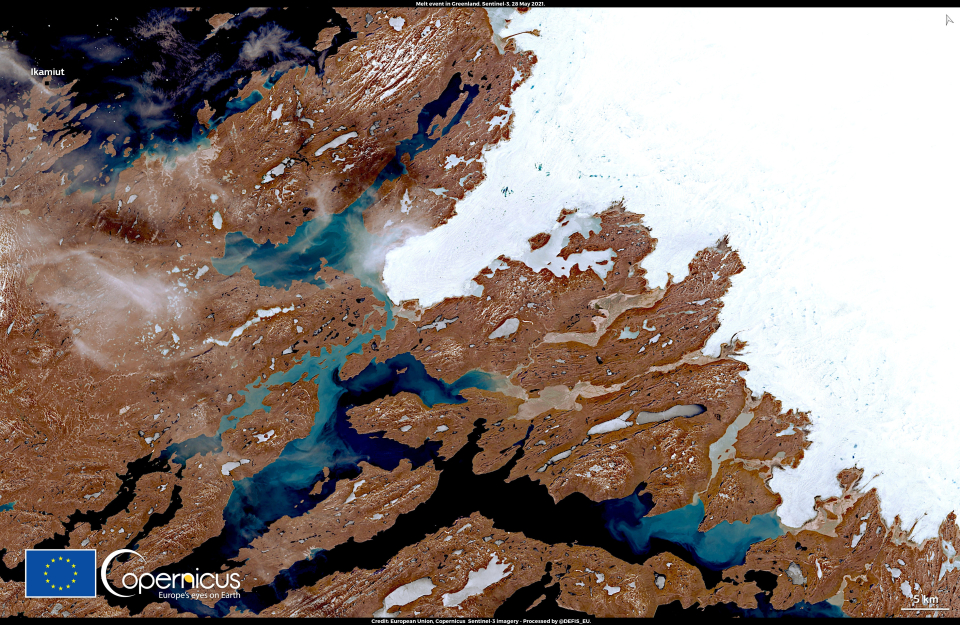
European Union, Copernicus Sentinel-2 imagery of the first significant melt event of 2021 in Greenland
A warming climate
Between 1992 and 2017, the Greenland and Antarctic ice sheets have together lost 6,400 gigatonnes (Gt) of ice, causing global sea levels to rise by nearly 2 centimetres (European State of the Climate Report 2019). The Greenland ice sheet loss rate has exponentially increased over time with almost half of the ice lost between 1992 and 2018 having occurred between 2006 and 2012. As for the Antarctic ice sheet, it is now losing ice faster than ever before. Prior to 2012, Antarctica lost ice at a steady rate of 76 Gt per year. However, there has since been a threefold increase with more than half the total ice loss of the last 28 years occurring between 2012 and 2017.
From 1993 to 2020, the global sea level has increased by about 3.1 centimetres (The Copernicus Marine Environmental Monitoring Service’s Ocean State Report 5). This report further states that the warming of the world’s oceans and melting land ice caused sea levels to rise by
- 2.5 mm per year in the Mediterranean;
- 4.5 mm per year in Baltic Sea;
- 4.2 mm per year in western Pacific Islands;
- 1.7 mm per year in the Black Sea;
- 3.6 mm per year in the Iberian Biscay Ireland Seas;
- 2.9 mm per year in the North West Shelf;
- 3.5 mm per year Central Pacific Islands and
- 3.4 mm per year in Pacific Islands.
30% of this global rise is directly attributable to ocean thermal expansion and 70% to land ice melt. Monitoring the Earth's polar ice sheets is therefore hugely important to determining their past, current, and future contributions to sea level rise and to mitigate the resulting impact on coastal populations.
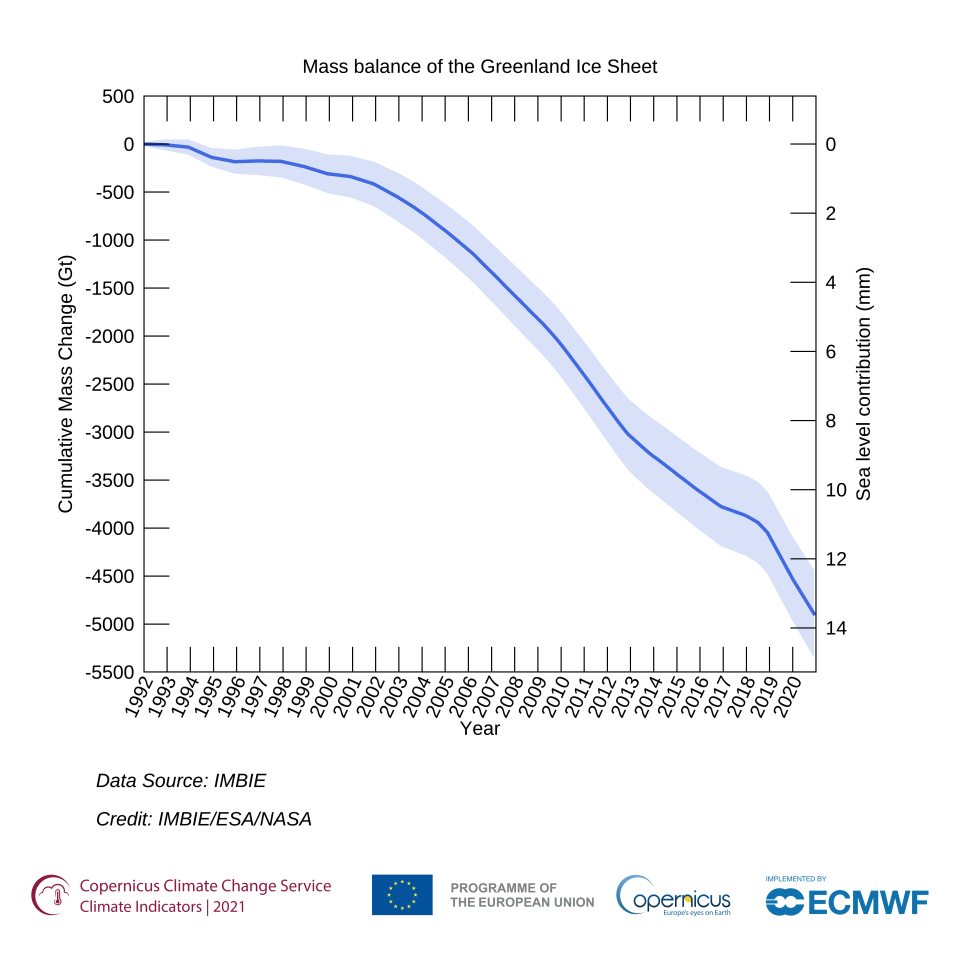
Cumulative total mass change of the Greenland Ice Sheet, and its corresponding contribution to sea level rise. The shading represents the cumulative uncertainty. Data source: IMBIE. Credit: IMBIE/ESA/NASA.
How can Copernicus help?
Thanks to its stable sensing geometry and high resolution, Copernicus Sentinel-2, helps monitor spatial changes over time, with a high revisit time of minimum 5 days. For instance, Sentinel-2 can track snow distribution and how fast it is melting or monitor the terminus where a glacier meets a lake or an ocean and enable the understanding of its dynamics over time. The high resolution of the data obtained allows monitoring at an individual glacier level. Thus, it is possible to link the changes undergone by each glacier to its type and its lithology, as well as its surrounding environment with its interacting elements, like fjord circulation (how ice and water move and coexist inside fjords) or ice buttressing (the stabilizing effect of ice sheets on the grounded parts of glaciers). Furthermore, the constant recording accomplished by the Sentinel satellites enables the accurate analysis of the monthly or weekly precursor motions of disasters such as landslides or mountain creeps which in turn allows for a better understanding of the mechanics of such natural hazards.
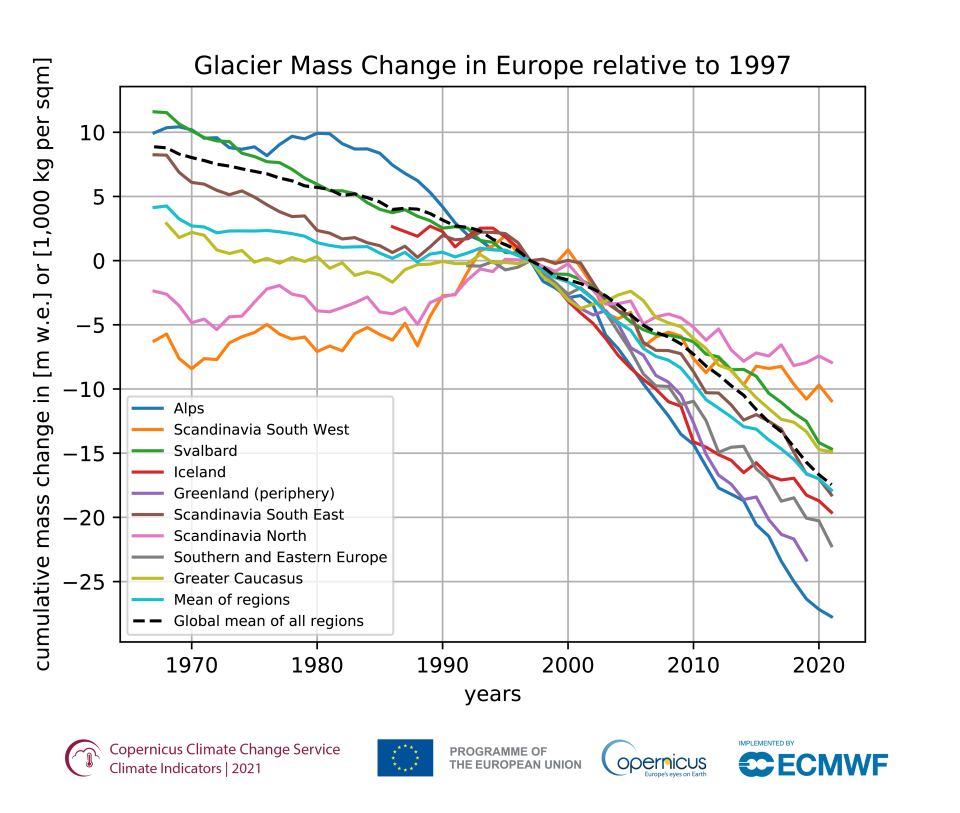
Cumulative mass changes in Europe from 1967 to 2021 for glaciers with long-term records in nine different regions. Mass balance values are given in the unit ‘metre water equivalent (m w.e.)’ relative to 1997. Data source: WGMS (2021, updated). Credit: C3S/WGMS.
Moreover, Copernicus Sentinel satellites provide accurate data on ice parameters such as the mass balance of the glacier or the total change in ice-thickness, which are critical to understand the current dynamics of the melting of glaciers, the shrinkage of ice sheets and the rise of sea levels. For example, sea level indicators such as maps of sea level anomalies are based on the data provided by Sentinel-6 (dedicated to sea level rise monitoring) and Sentinel-3. Many of the datasets mentioned above are freely available, in the Climate Data Store (CDS) of the Copernicus Climate Change Service (C3S), monitored monthly in the Copernicus Marine Service (CMEMS, sea level maps) and annually published in the annual ocean state report (5th edition, June 2022).
Source:
OBSERVER: Monitoring Glaciers from Space | Copernicus. (2022, November 3).