Published on 6 May 2022
The Rhine River, visible here in black, flows from the Swiss Alps to the North Sea through Switzerland, Liechtenstein, Austria, France, Germany, and the Netherlands. In the image, the Rhine flows from bottom-right to top-left. The river is an important waterway with an abundance of shipping traffic, with import and export goods from all over the world.
The picturesque Rhine Valley has many forested hills topped with castles and includes vineyards, quaint towns and villages along the route of the river. One particular stretch that extends from Bingen in the south to Koblenz, known as the Rhine Gorge, has been declared a UNESCO World Heritage Site (not visible). Cologne is visible at the top of the image.
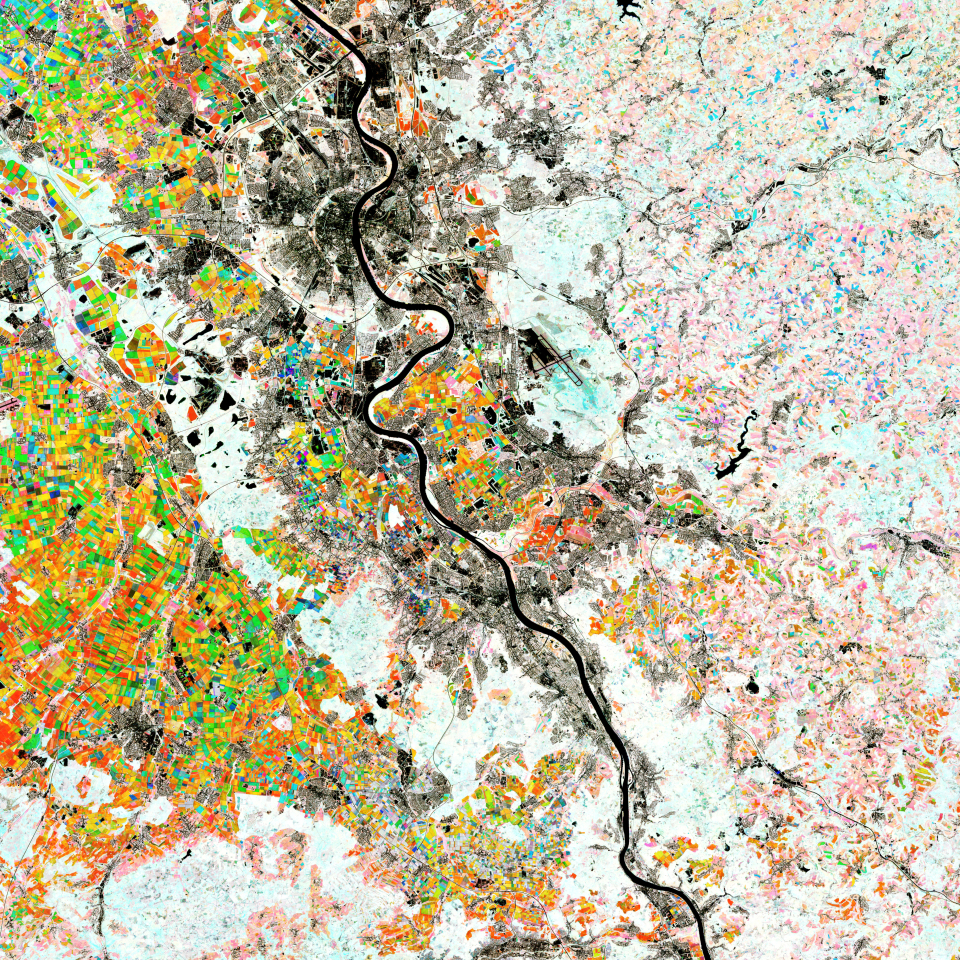
This composite image was created by combining three separate Normalised Difference Vegetation Index (NDVI) layers from the Copernicus Sentinel-2 mission. The Normalised Difference Vegetation Index is widely used in remote sensing as it gives scientists an accurate measure of health and status of plant growth.
Click here to view the image at full resolution.
Each colour in this week’s image represents the average NDVI value of an entire season between 2018 and 2021. Shades of red depict peak vegetation growth in April and May, green shows changes in June and July, while blue shows August and September.
Colourful squares, particularly visible in the left of the image, show different crop types. The nearby white areas are forested areas and appear white as they retain high NDVI values through most of the growing season, unlike crops which are planted and harvested at set time frames. Light pink areas are grasslands, while the dark areas (which have a low NDVI) are built-up areas and water bodies.
Read the rest of the article
over on ESA's Observing the Earth website