Published 2 days ago
The Israel-Hamas conflict has triggered attacks on commercial vessels in the Gulf of Aden by the Yemen-based Houthi movement, disrupting trade operations and leading to the re-routing of vessels away from the Red Sea through the Cape of Good Hope, off the coast of South Africa. Researchers at the Royal Belgian Institute for Space Aeronomy and the Aristotle University of Thessaloniki, Greece, developed a method to isolate the contribution of ship emissions in the satellite observations of NO2 from the TROPOMI sensor. They applied this method to assess the impact of the Red Sea shipping crisis on NO2 levels along major shipping routes between Asia, Middle East and Europe.
Significant change in the satellite shipping signal of NO2
The maritime sector carries approximately 80% of global goods and is of vital importance for the global economy. However, shipping activities release substantial amounts of nitrogen oxides (NOx=NO2 and NO), a class of pollutants known to favor ozone formation.
Monitoring the shipping signal from space presents challenges due to its weak features and contamination by outflow pollution from continental regions. In order to assess the impact of Red Sea attacks on ship emissions, we designed a method to enhance the satellite shipping signal from the high spatial resolution TROPOMI instrument (3.5 km × 5.5 km) aboard the Sentinel-5p space probe of the European Space Agency (ESA).

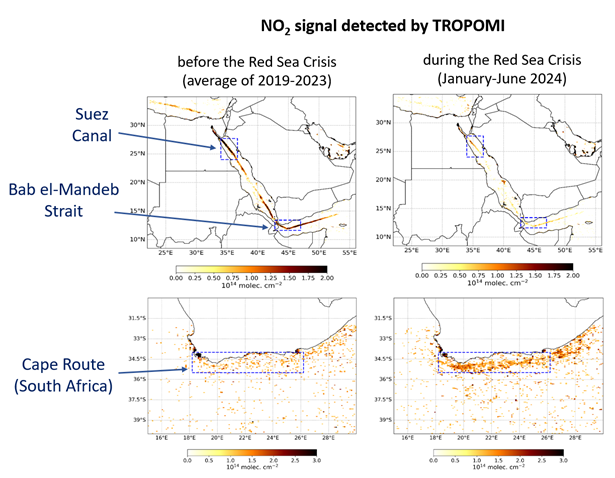
Figure 1. NO2 shipping signal before the Red Sea Crisis (left) and during the Red Sea Crisis, in January-June 2024 (right), over the Red Sea and along the South African coastline. Blue boxes indicate the examined shipping tracks. Over the Red Sea, the shipping NO2 signal is much weaker in 2024 than in previous years, as direct consequence of the Houthi attacks. Off the coast of South Africa, the opposite is found, since the maritime traffic between Asia and Europe is partly diverted around Africa to avoid the Red Sea.
High correlations between the number of vessels and the NO2 shipping signal
We find that the NO2 shipping signal derived from TROPOMI in the Red Sea was significantly reduced in January-June 2024, compared to previous years. This is in line with reports of the number of vessels for the same periods and regions. On the contrary, both the NO2 shipping signal and the number of ships have increased off the coast of South Africa, in the Cape of Good Hope Strait (Figure 1 and 2). The number of vessels is obtained from open-access platforms tracking the ships operating in international ports and maritime routes.

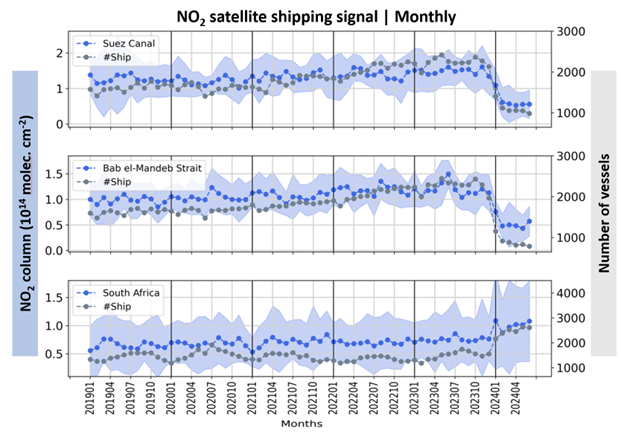
Figure 2. In blue, the monthly NO2 satellite-derived shipping signal, after removal of seasonal variability, over the Suez Canal, the Bab el Mandeb Strait, and the Cape Route in South Africa. In grey, the number of vessels. Over the Red Sea (Suez Canal and Bab el Mandeb Strait), the sharp decrease in the NO2 signal in early 2024 matches the corresponding decrease of the number of vessels. The opposite trend is seen along the coast of South Africa. The shaded blue areas show the monthly uncertainty estimates of the NO2 shipping signal.
As seen in Figure 2, the monthly NO2 shipping signal demonstrates a strong temporal correlation with the total number of vessels. Over the Suez Canal, the monthly number of vessels steadily increased from January 2019 (~1500 vessels) to November 2023 (~2500 vessels); after the recent attacks, it decreased sharply to unprecedented levels (~1000 vessels in March 2024). This pattern is well captured by the satellite data. Similar results hold for the Bab el Mandeb Strait, which connects the Red Sea and the Indian Ocean.
Along the Cape Route in South Africa, which is the alternative route used by ships to avoid the Red Sea, the number of vessels (~1500) and the satellite signal are very stable during 2019-2023. In January 2024, more than 2200 ships passed through this route, equivalent to a ~45% increase compared to the 2019-2023 period, whereas a ~40% increase in the NO2 shipping signal was observed along the shipping lane.
The excellent correspondence between the NO2 satellite signal and the number of vessels demonstrates that shifts in the maritime commercial routes can be detected using TROPOMI NO2 data.
Source:
Royal Belgian Institute for Space Aeronomy [BIRA-IASB]. (2024, November 4). Satellite detection of shifts in maritime trade routes as a result of Red Sea shipping crisis.