Published on 9 August 2022
How green is my municipality has added a new 2020 land cover map. This demonstration project was launched in 2018 with a first land cover map for 2017 to easily demonstrate how satellite images and other Earth observation data can be used to provide objective and valuable information about our land cover and land use. Later on a 2019 map was published and now there’s also an update available for 2020.
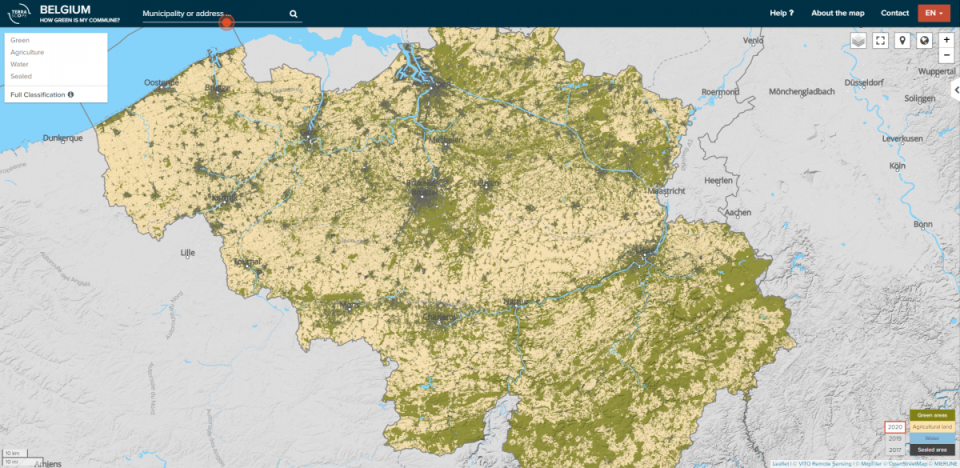
‘How green is my municipality’ is a basic classification of all Belgian cities and municipalities based on images from various Copernicus Sentinel satellites. The classification map shows how many green areas, agricultural fields, water and non-vegetated areas there are and where they are located. You can easily look up how 'green' a municipality or city is, compare it with other municipalities or cities and view and compare land use statistics over the years.