Publié le 1 août 2022
From their unique vantage point, satellites provide key lines of scientific evidence to understand the climate.
From space, the evidence for climate change is compelling.
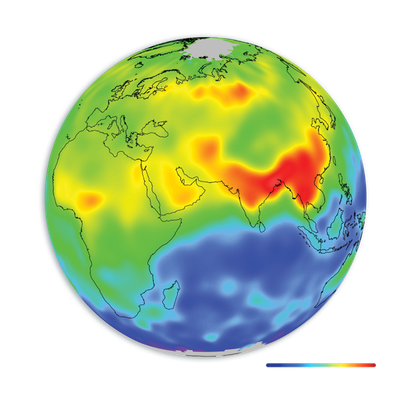
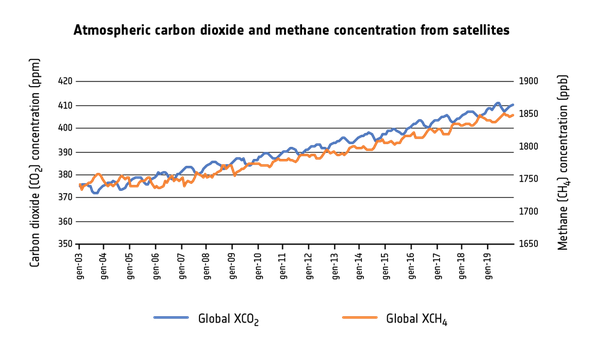
Unprecedented levels of greenhouse gases
Levels of carbon dioxide and methane in the atmosphere – the primary drivers of human-induced climate change – are at record levels and continue to rise.
Satellites are used to detect the smallest change in atmospheric concentration. They show carbon dioxide rose to 407 ppm in 2018, while methane concentrations are now around 150% above pre-industrial levels (Buchwitz, M. et al. 2018) – and continue to rise.
By accurately detecting these small changes – to within 1 part per million for carbon dioxide – satellite observations are helping the scientific community to improve global climate models and better predict the likely warming effect and impacts resulting from increased levels of greenhouse gases in the atmosphere.
ESA's Climate Change Initiative Greenhouse Gas project is mapping the global distribution of near-surface carbon dioxide and methane. The team undertaking research to improve on the current operational products initially developed by the Climate Change Initiative, but now transferred and extended annually by the EU’s Copernicus Climate Change Service.
|
|
The project team is using data from the latest generation of satellites, including the Copernicus Sentinel-5P mission, NASA's Orbiting Carbon Observatory (OCO-2), and the China National Space Administration’s TanSat mission to observe these greenhouse gases in the greatest detail yet. These satellites provide even higher resolution data and are equipped with the ability to distinguish between natural and human sources of carbon dioxide and methane and in turn support emissions reduction policies such as the Paris Agreement that are addressing global warming.
Shrinking of the cryosphere is widespread
The cryosphere – the areas on Earth where water is frozen – plays an important role in moderating global climate.
Global warming has led to a widespread shrinking of the cryosphere in recent decades, across the polar ice sheets and glaciers, terrestrial snow cover, Arctic sea ice extent and thickness, with permafrost temperatures rising too, according to a recent report by the IPCC (IPCC Special Report on the Ocean and Cryosphere in a Changing Climate, 2019).
In these often vast, remote areas, satellites have provided crucial insights into the rapid changes underway.
Changing Ice sheets
Polar ice-sheets store more than 99% of Earth’s freshwater ice on land. Even modest changes can influence global sea level, increase coastal flooding, and disturb oceanic currents.
Both the Antarctic and Greenland Ice Sheets are changing rapidly. A recent ESA / NASA funded international assessment shows they are losing ice mass six times faster than in the 1990s – a rate that is currently tracking the IPCC’s high end climate warming scenario (IMBIE Shepherd, A. et al., 2020).
|
|
Total combined loss of ice mass across Greenland and Antarctica is estimated at 6.4 trillion tonnes between 1992 and 2017 – pushing global sea levels up by 17.8 millimetres.
Of the total sea level rise coming from melting polar ice sheets, around 60% (10.6 millimetres) was due to Greenland ice losses and 40% was due to Antarctica (7.2 millimetres).
Using satellite data scientists estimate that polar ice sheets are responsible for a third of all sea level rise.
Retreating Glaciers
Glacier mass loss is linked to increasing air temperatures, making them a reliable indicator of climate change. In a warming world, their meltwater contributes to rising sea levels and these changes affect water availability around the world.
Satellite scans help to chart long-term glacier changes on a local, regional and global scale. Their ability to remotely monitor changing surface area, height, mass and the speed at which glaciers flow helps to estimate how these factors contribute to sea-level rise and the release of more freshwater.
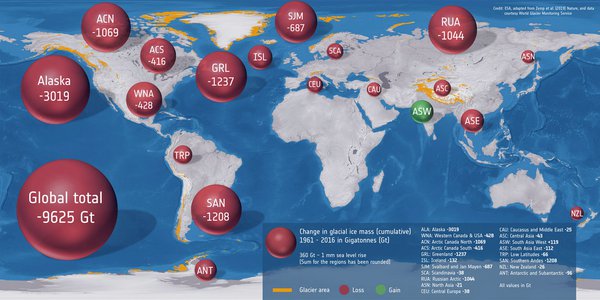
Change in global ice mass (cumulative) 1961-2016 in Gigatonnes
Glaciers around the world have lost well over 9,000 gigatonnes (nine trillion tonnes) of ice since 1961 (Zemp, M., et al., 2019). As glaciers have retreated, scientists estimate the loss of glacier ice has accounted for 21 % of global sea-level rise between 1993 and 2017 (WCRP Global Sea Level Budget Group, 2018).
Key to assessing these changes or to model their future evolution is the existence of a detailed inventory – a collection of key physical characteristics of glaciers. The ESA Climate Change Initiative’s glacier project provided a third of the 198,000 glacier outlines that comprise the Randolph Glacier Inventory, the world’s first globally complete inventory. This resource provides the authoritative observed evidence on trends and formed a major contribution to sea level change assessments made in the IPCC Fifth Assessment report.
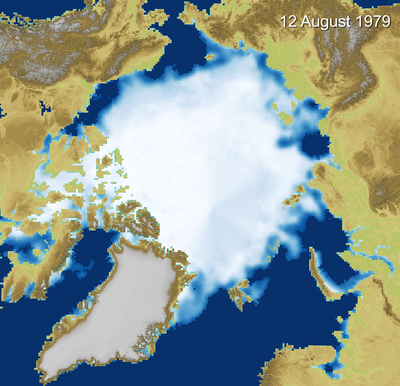
Declining Sea Ice
The long term decline in polar sea ice provides one of the clearest indications of change in the Earth’s environment.
From space we can observe a long-term decline in Arctic sea ice extent, in all months from 1979–present.
The strongest reduction is observed annually in late summer and estimates suggest that the area of sea ice has fallen from 8 million km² during September in the late 1970s to about 4 million km², its lowest extent, during 2012.
|
|
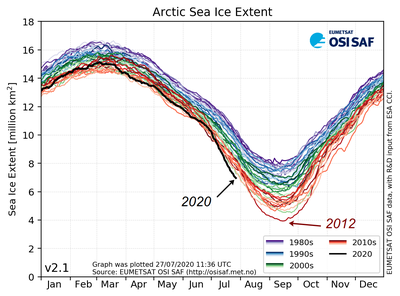
Developed jointly by ESA’s Climate Change Initiative Sea Ice project and the EUMETSAT OSI SAF, the sea ice satellite record spans over forty years to the present day. It is a key tool, enabling the science community to evaluate and improve the accuracy of climate model predictions, and to monitor change and assess trends with greater confidence.
Using this data, climate modellers have used established a clear link between decreasing summer Arctic sea ice cover and cumulative carbon dioxide emissions from human activity.
A recent study estimates that three square metres of Arctic sea ice is lost for every tonne of carbon dioxide emissions (Notz and Stoeve, 2016).
The latest generation of climate models, which are validated using the ESA CCI sea ice satellite record, indicate that the Arctic Ocean could be ice free during summer months as early as 2050.
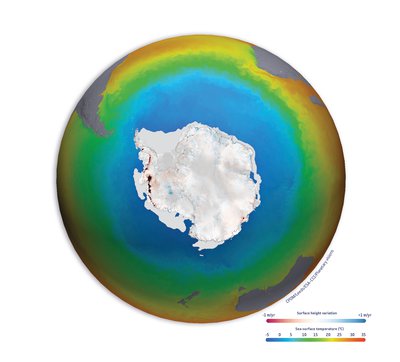
Rising sea levels
Sea level has risen globally by around 15 cm during the 20th century and is currently rising more than twice as fast at a rate of 3.6 mm per year (between 2006-2015).
According to the IPCC Special Report on the Ocean and Cryosphere in a Changing Climate, sea level rise could reach 60-110 cm by 2100 in model projections that assume countries take little action to cut greenhouse gas emissions. This would make flooding an annual occurrence, increasing the risks faced by 1.9 billion people living in low-lying coastal regions.
Important contributors to rising sea level include: thermal expansion in response to rising seawater temperature and the addition of fresh water as ice sheets and glaciers lose mass. We know this because specialised sensors on Earth-observing satellites measure the temperature of the sea surface and the changes in ice and glaciers.
|
|
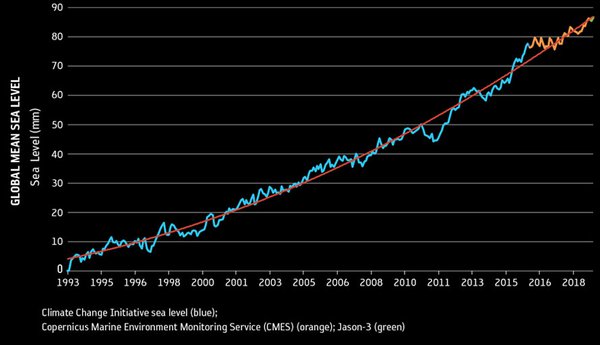
By merging observations from 11 different satellite missions, the ESA Climate Change Initiative Sea Level project has generated a highly precise and continuous 25-year record of sea surface height (Ablain, M. et al.(2017); Legeais, J-F. et al. (2018)).
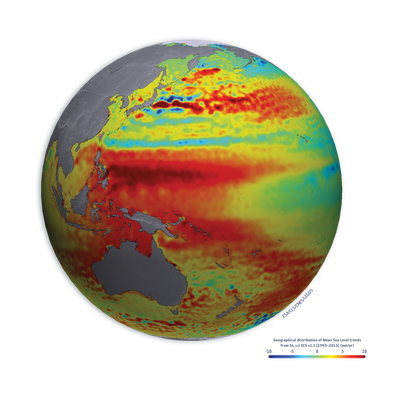
An accurate understanding of the changes in global sea level, including important regional differences, is vital for the international community to develop an effective response.
Sea level does not rise uniformly everywhere - measurements only possible by satellite show how sea levels across the globe vary due to winds, atmospheric pressure, the ocean floor, Earth's rotation as well as the water's temperature and salinity.
Decreasing snow cover and snow mass
Snow cover is very sensitive to an increase in temperature. Satellite data show that as global temperatures rise, snow extent decreased at a rate of (−0.55 ± 0.21) × 106 km² per decade in spring over the entire Northern Hemisphere in the 1980s and the 21st century (Thackeray, C. et al. (2016)).
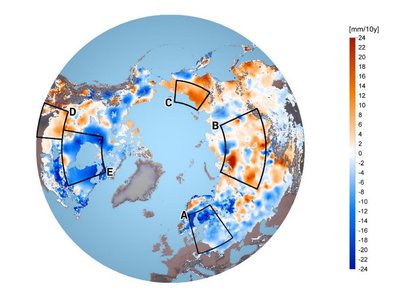
Changes in snow mass 1980-2018, from Pulliainen J et al (2020)
ESA’s Climate Change Initiative snow project provides the first reliable estimate of snow mass change, using a 39-year global time series based on passive microwave satellite observations. Continental trends have been observed. For example, snow mass decreased by 46 gigatonnes per decade across North America. Although this was not reflected in Eurasia, high regional variability was observed.
Based on current trends and the threshold of 1.5 °C rise in surface temperature, climate models predicted that snow mass will decrease up to 40% in central North America, Western Europe, and northwest Russia, relative to 1986–2005.
Monitoring climate from space
Measurements from ESA missions provide a substantial contribution to climate monitoring. Observations from ESA’s 40-year satellite archive as well as from current ESA missions, the Copernicus Sentinels and third-party missions are harnessed by ESA's Climate Change Initiative to generate consistent, long-term and global data records for 21 key Essential Climate Variables.
These trusted records support the UNFCCC process that drives international climate action. They are used in association with Earth System Models to study drivers, interactions and feedbacks due to climate change, as well as reservoirs, teleconnections, tipping points, and fluxes of energy, water, carbon and more.