Publié le 17 mars 2022
An international team of scientists has mapped the global footprint of giant methane leaks from oil and gas operations for the first time, thanks to high-resolution data delivered by Copernicus' Sentinel-5P. This analysis of the potent planet-warming gas – which revealed thousands of large plumes that spilled out from major oil and gas pipelines – could have a key role in the revitalised international drive to tackle the climate crisis.
Methane is less abundant in the atmosphere than carbon dioxide, but it is a more powerful heat-trapping gas. According to the Intergovernmental Panel on Climate Change, it is estimated to have contributed to 30-50% of current global temperature increases. As a result, scientists believe that addressing methane leaks from human activities could be key in efforts to address climate change – and at COP26 last year over 100 countries set out a bold new commitment to cut these emissions.
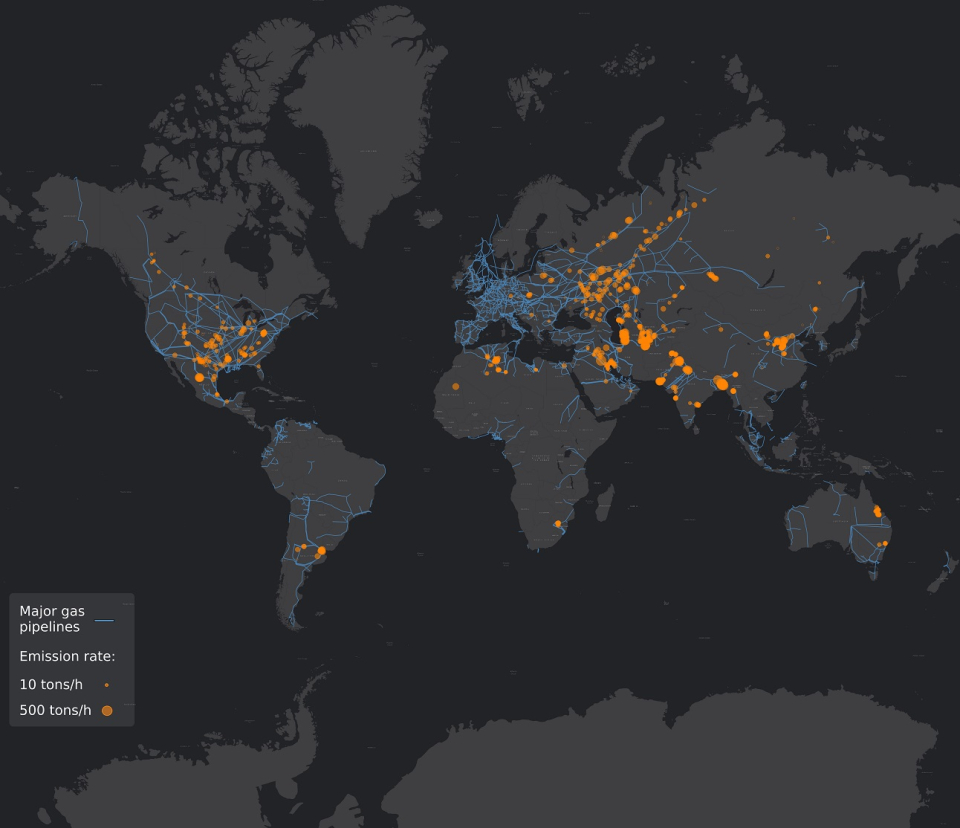
Map of oil and gas ultra-emitters derived from measurements collected by Copernicus Sentinel-5P’s TROPOMI instruments. The orange circles represent methane measurements and the blue lines represent major gas pipeline.
Click here to view at full resolution.
Sentinel-5P – the first mission of the European Union’s Copernicus Programme dedicated to monitoring air pollution – is transforming scientist’s understanding of emissions in the atmosphere. The satellite’s TROPOspheric Monitoring Instrument (TROPOMI) detects the unique fingerprints of gases across different parts of the electromagnetic spectrum, delivering daily high-resolution global information on emissions.
From 2019 to 2020, the instrument revealed numerous individual incidences of unintended and deliberate giant methane leaks around the planet. As part of the research, scientists used this set of data to build a comprehensive global picture of emissions hotspots. A method developed by ESA-backed data analytics firm Kayrros was used to generate daily information on methane plumes. An automated detection algorithm – which takes into account changes to meteorological conditions – was applied to the Copernicus data to identify large methane plumes, and further advanced analysis was used to determine leak duration. The resultant emissions were quantified using a mathematical modelling approach.