Publié le 24 janvier 2022
When a volcano in the South Pacific Kingdom of Tonga began erupting in late-December 2021 and then violently exploded in mid-January 2022, NASA scientist Jim Garvin and colleagues were unusually well positioned to study the events. Ever since new land rose above the water surface in 2015 and joined two existing islands, Garvin and an international team of researchers have been monitoring changes there. The team used a combination of satellite observations and surface-based geophysical surveys to track the evolution of the rapidly changing piece of Earth.
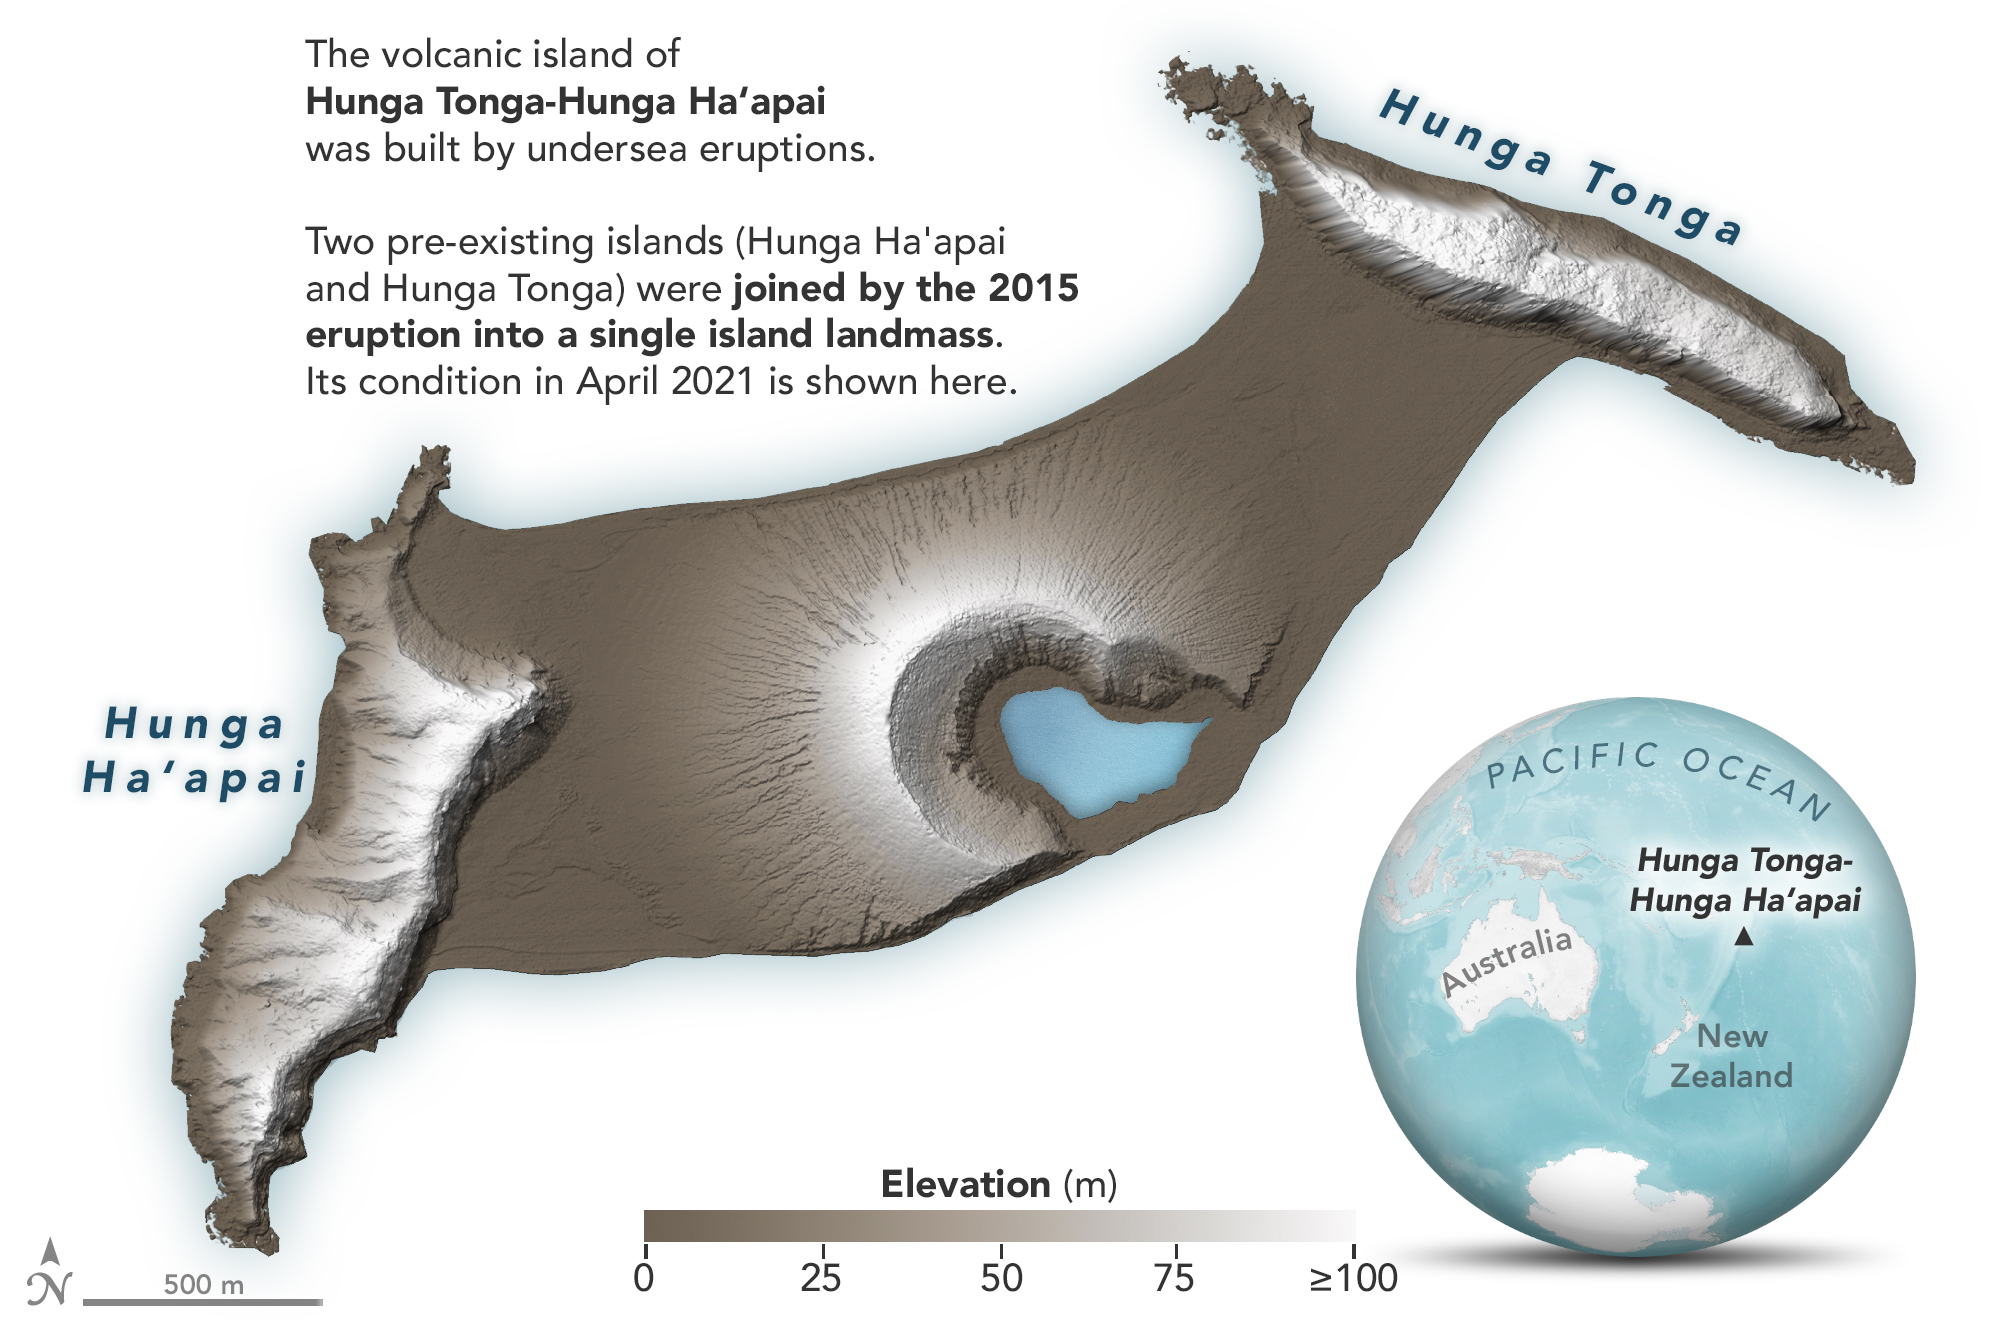
The digital elevation maps above and below show the dramatic changes at Hunga Tonga-Hunga Ha‘apai, the uppermost part of a large underwater volcano. It rises 1.8 kilometers (1.1 miles) from the seafloor, stretches 20 kilometers (12 miles) across, and is topped by a submarine caldera 5 kilometers in diameter. The island is part of the rim of the Hunga Caldera and was the only part of the edifice that stood above water.
Now all of the new land is gone, along with large chunks of the two older islands.

“This is a preliminary estimate, but we think amount of energy released by the eruption was equivalent to somewhere between 5 to 30 megatons of TNT,” said Garvin, chief scientist at NASA’s Goddard Space Flight Center. “That number is based on how much was removed, how resistant the rock was, and how high the eruption cloud was blown into the atmosphere at a range of velocities.” The blast released hundreds of times the equivalent mechanical energy of the Hiroshima nuclear explosion. For comparison, scientists estimate Mount St. Helens exploded in 1980 with 24 megatons and Krakatoa burst in 1883 with 200 megatons of energy.
Garvin and NASA colleague Dan Slayback worked with several researchers to develop detailed maps of Hunga Tonga-Hunga Ha‘apai above and below the water line. They used high-resolution radar from the Canadian Space Agency’s RADARSAT Constellation Mission, optical observations from the commercial satellite company Maxar, and altimetry from NASA’s ICESat-2 mission. They also used sonar-based bathymetry data collected by the Schmidt Ocean Institute, in partnership with NASA and Columbia University.
Continue reading the article
on the NASA Earth Observatory website