Publié le 10 février 2022
After being installed on the International Space Station, two small instruments designed and built at NASA’s Jet Propulsion Laboratory in Southern California were powered up Jan. 7 and began collecting data on Earth’s ocean winds and atmospheric water vapor – critical information required for weather and marine forecasts. Within two days, the Compact Ocean Wind Vector Radiometer (COWVR) and Temporal Experiment for Storms and Tropical Systems (TEMPEST) instruments had gathered enough data to begin producing maps.
COWVR and TEMPEST launched on Dec. 21, 2021, with SpaceX’s 24th commercial resupply mission for NASA. Both instruments are microwave radiometers, measuring variations in natural microwave emissions from Earth. Part of the U.S. Space Force’s Space Test Program-Houston 8 (STP-H8), the instruments were designed to demonstrate that they can collect data comparable in quality to the larger instruments currently operating in orbit.
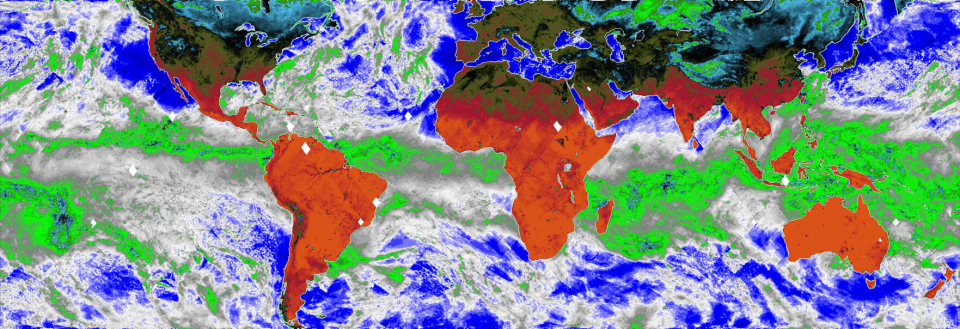
This new map, made using COWVR’s new observations, shows Earth’s microwave emissions at a frequency that provides information on the strength of winds at the ocean surface, the amount of water in clouds, and the amount of water vapor in the atmosphere. Credit: NASA/JPL-Caltech
Click here to view the image at full resolution.
This new map from COWVR shows microwave emissions from Earth at 34 gigahertz through all latitudes visible to the space station (52 degrees north to 52 degrees south). This particular microwave frequency provides weather forecasters information on the strength of winds at the ocean surface, the amount of water in clouds, and the amount of water vapor in the atmosphere.
Green and white on the map indicate higher water vapor and clouds, while dark blue over the ocean indicates drier air and clear sky. The image captures typical weather patterns, such as tropical moisture and rain (the green band stretching across center of map) and mid-latitude storms moving across the ocean.
Read the rest of the article
over on NASA's Global Climate Change website