Publié le 8 janvier 2020
As the New Year rang in, torrential rains swept across Jakarta, Indonesia, bringing the capital’s worst rainfall in more than a decade. On December 31 and January 1, heavy rains poured over the city, triggering floods and mudslides, knocking out power, displacing about 175,000 people, and killing more than 60 people, according to media reports. As of January 6, 2020, at least 74 districts in Jakarta, West Java, and Banten had reported floods since the beginning of the year.
Indonesia’s Meteorology, Climatology and Geophysics Agency (BMKG) said the heavy rains were triggered by a convergence of wind patterns. Winds blowing from northeast of Java Island met moist winds from the Indian Ocean to the south, which led to the formation of massive rain-producing clouds. Additionally, high temperatures increased the amount of water vapor in the air.
Since the rains began, researchers at NASA and partner agencies have been analyzing satellite- and ground-based data to locate potentially flooded areas. The flood proxy map above highlights areas that were likely to be flooded (indicated in blue) as of January 2, 2020. The data is currently being used by the ASEAN Humanitarian Assistance center, which has been working with the Indonesian National Board for Disaster Management (BNPB) to guide emergency responders. The information has also been used in reports to inform the Indonesian public.
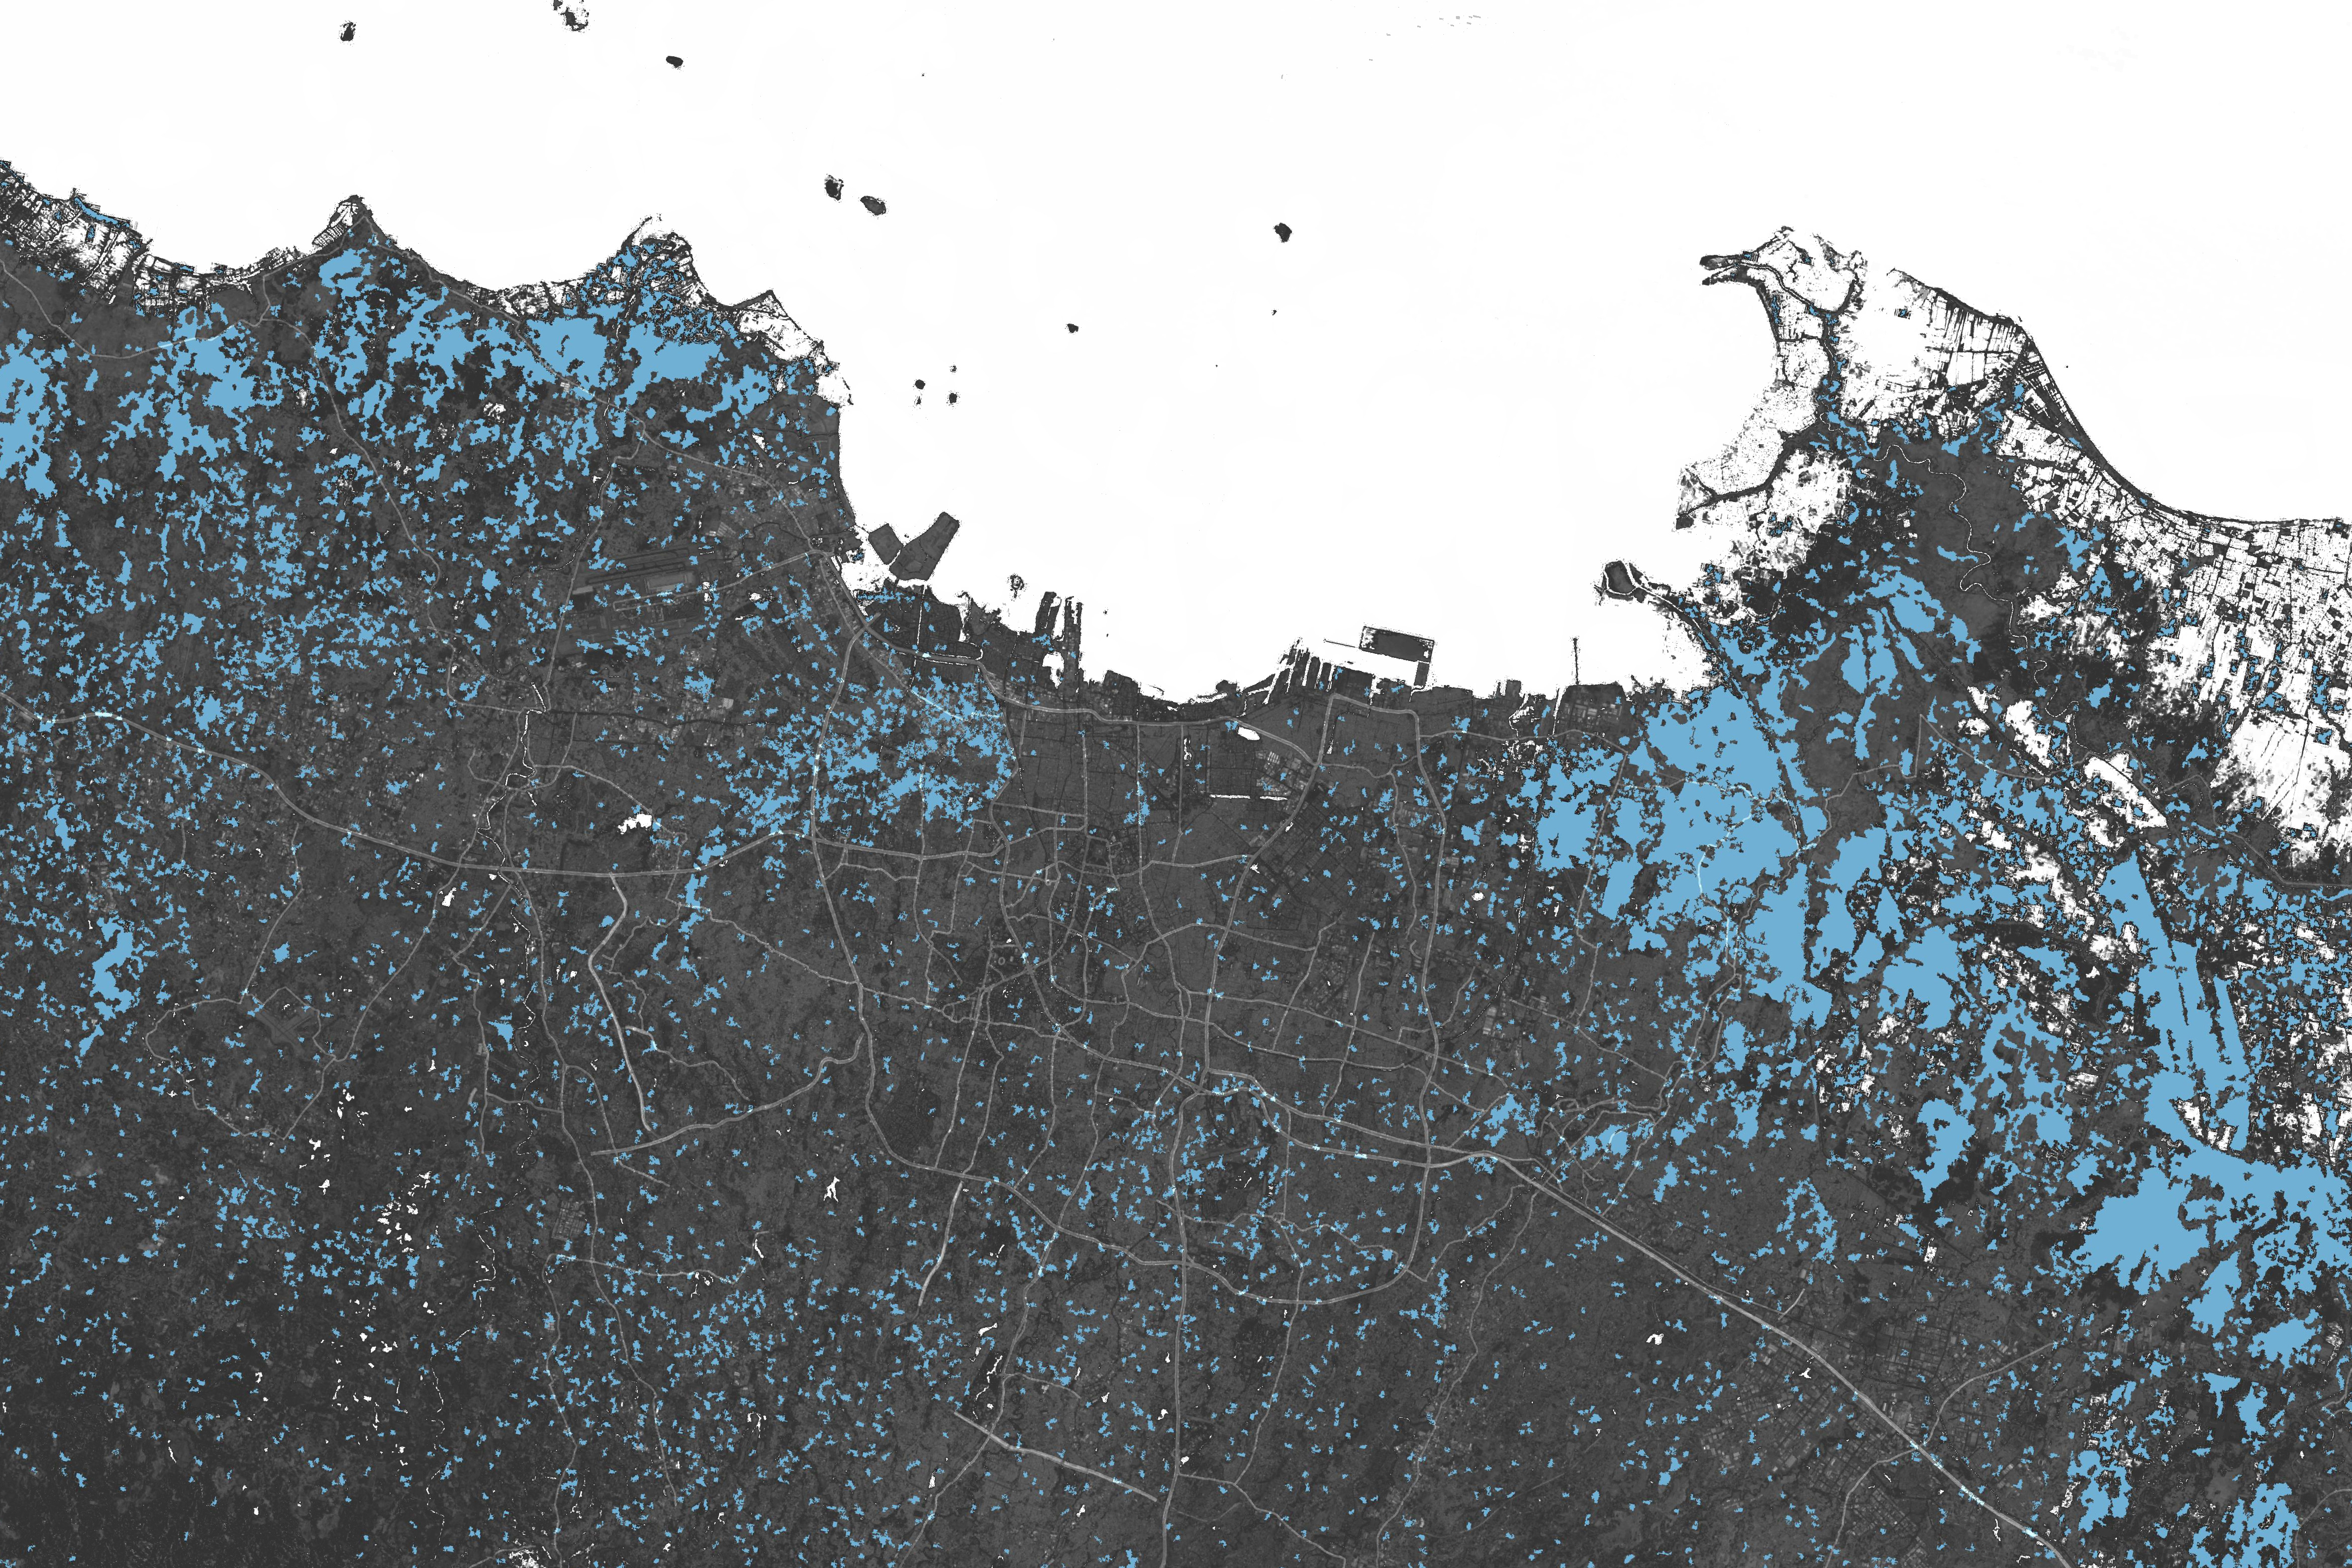
The map is derived from Synthetic Aperture Radar (SAR) data from the Copernicus Sentinel-1 satellites, operated by the European Space Agency (ESA). Though natural-color imagery of the flooded area has been hard to gather, radar can see through clouds. The flood proxy maps were generated by the Advanced Rapid Imaging and Analysis (ARIA) team, a joint collaboration between NASA’s Jet Propulsion Laboratory and the California Institute of Technology. The ARIA team collaborated with Earth Observatory of Singapore and was supported by the NASA Earth Science Disasters Program.