Gepubliceerd op 18 september 2020
Air pollution is one of the biggest environmental problems of our time. According to a new report from the European Environment Agency (EEA), air pollution now contributes to one in eight deaths in Europe. Observations from the Copernicus Sentinel-5P satellite have been vital in tracking the evolution of air pollution, specifically nitrogen dioxide concentrations, across Europe.
This year, satellite data have been widely used to monitor fluctuations in air quality brought on by strict COVID-19 measures. The Copernicus Sentinel-5P satellite, part of the European Copernicus programme, has been continuously mapping changes of air pollution since its launch in 2017.
Scientists from the Royal Netherlands Meteorological Institute (KNMI) and the Royal Belgian Institute for Space Aeronomy (BIRA-IASB) have used satellite data from Sentinel-5P and ground-based data in order to pinpoint the correlation between COVID-19 and the effects of air pollution across Europe.

These images, using data from the Copernicus Sentinel-5P satellite, show the average nitrogen dioxide concentrations from March to April (upper panels) and July to August (lower panels) in 2019 and 2020, and their difference maps. After a strong column decrease observed during the lockdown in March-April 2020, the majority of Europe returned to similar 2019 levels of nitrogen dioxide concentrations, except for large cities, where the nitrogen dioxide levels remain lower than in 2019.
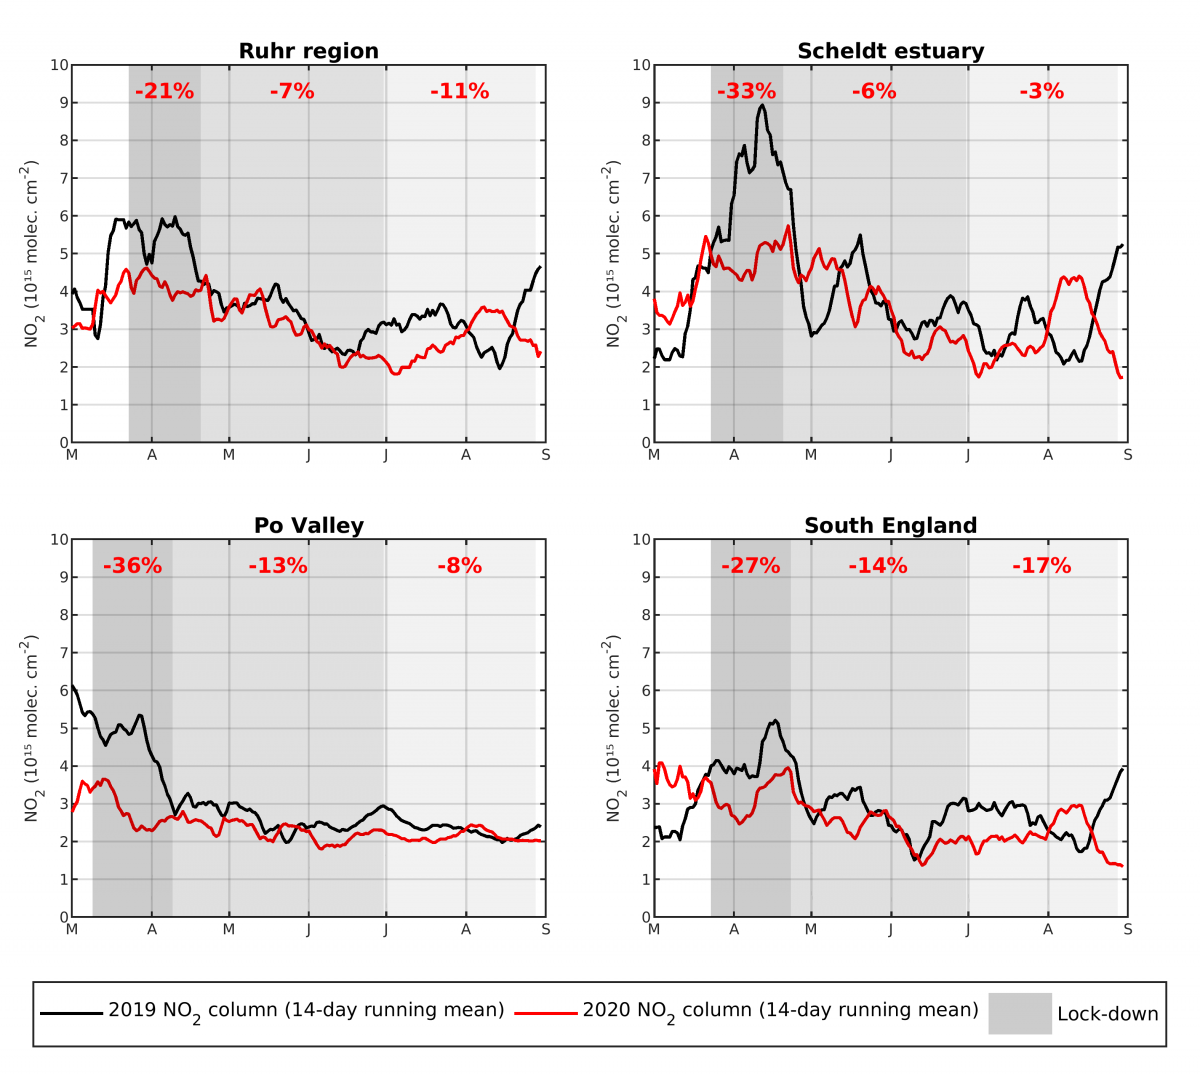
This graph shows the averaged nitrogen dioxide concentrations over the Ruhr region, Scheldt estuary, Po Valley and South England. The graphs shows concentrations (using a 14-day moving average) in 2019 compared to 2020 using data from the Copernicus Sentinel-5P satellite.
The shades of grey denote the lockdown periods in 2020, moving progressively from strict (dark grey) to loose (light grey) measures. The percentages shown in red represent the column reduction in 2020 compared to 2019 over the same period.