Gepubliceerd op 15 maart 2021
On 23 January 2020, the world saw the first coronavirus lockdown come into force in Wuhan, China in an effort to stop the spread of the illness. This lockdown set the precedent for similar measures in other cities across the country, putting a halt to daily activities including industry and traffic. Factories and other industries were shut down and people were confined to their homes. Similar measures were then put in place worldwide in the following weeks and months.
As a result, a significant reduction in air pollutants across China was detected by satellites. This included reduced emissions of nitrogen dioxide – a gas which pollutes the air mainly as a result of traffic and the combustion of fossil fuel in industrial processes.
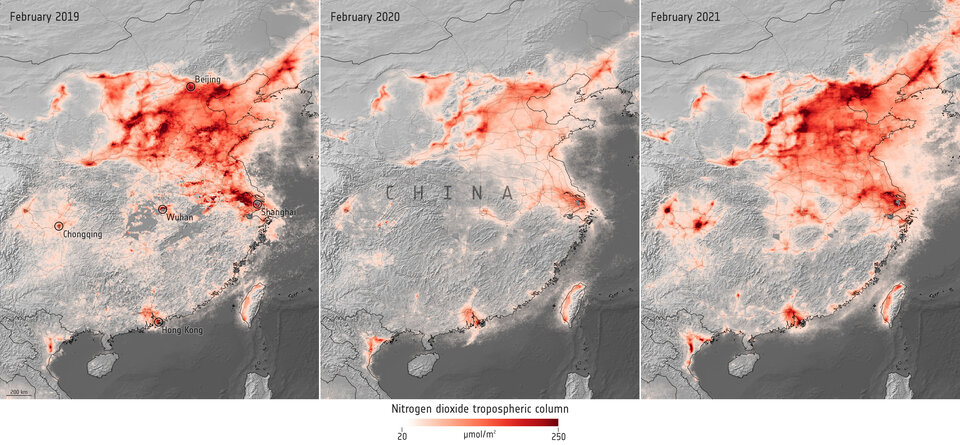
Now, more than one year later, as restrictions have eased, the average level of air pollutants has rebounded and is on the rise again. The maps below show the monthly average concentrations of nitrogen dioxide, derived from data from the Copernicus Sentinel-5P satellite, in the central and eastern portions of China in February 2019, February 2020 and February 2021. The map shows the fluctuation in levels between the three periods, with dark red indicating high concentrations of nitrogen dioxide.
Nitrogen dioxide concentrations over China. Click the image to view at full resolution
The data indicate that nitrogen dioxide concentrations in Beijing dropped by around 35% between February 2019 and 2020, before returning to similar levels in February 2021. Similarly, in Chongqing, nitrogen dioxide dropped by approximately 45% between February 2019 and February 2020, before returning to almost double pre-COVID numbers.
