Gepubliceerd op 18 april 2024
As the world struggles to cope with the impacts of climate change, accessible tools to understand our changing climate have never been more urgently needed. Launched on 20 February by the Copernicus Climate Change Service (C3S), the Copernicus Interactive Climate Atlas (C3S Atlas) is a powerful new tool designed to help policymakers and other climate service users to analyse and interpret climate data. With the upcoming publication of the European State of the Climate report by C3S, we are excited to discuss this new tool that can help users develop evidence-based policies and strategies to work to mitigate the consequences of and adapt to global warming.
Evolving climate information
The last few decades have seen a gradual but constant increase in the societal relevance of climate information. Starting with the establishment of the United Nations Framework Convention on Climate Change (UNFCCC), the Intergovernmental Panel on Climate Change (IPCC), and the World Meteorological Organization’s Global Framework for Climate Services (GFCS), the focus has gradually shifted away from pure climate science and towards climate services in support of policies and decisions. The Copernicus Climate Change Service, or C3S represents another step in this process.
The IPCC’s Sixth Assessment Report (AR6), released in August 2021, was also a critical milestone in this journey. For the first time, the Report included the IPCC Interactive Atlas (IPCC-IA), an interface that supports and expands the Report’s regional climate assessment. The IPCC-IA as published was designed to be static until the next Assessment Report (AR7).
The new C3S Atlas introduces an interactive, live, and continuously evolving tool that customises climate data for specific users and regions. The Copernicus Climate Change Service carried out the work in collaboration with a data management company, Predictia, and the Spanish Research Council’s (CSIC) Cantabria Institute of Physics, IFCA.
So, what’s new?
The C3S Atlas now includes observational, reanalysis, and climate projection datasets from the C3S Climate Data Store. It displays updates with the latest data and new viewer functionalities.
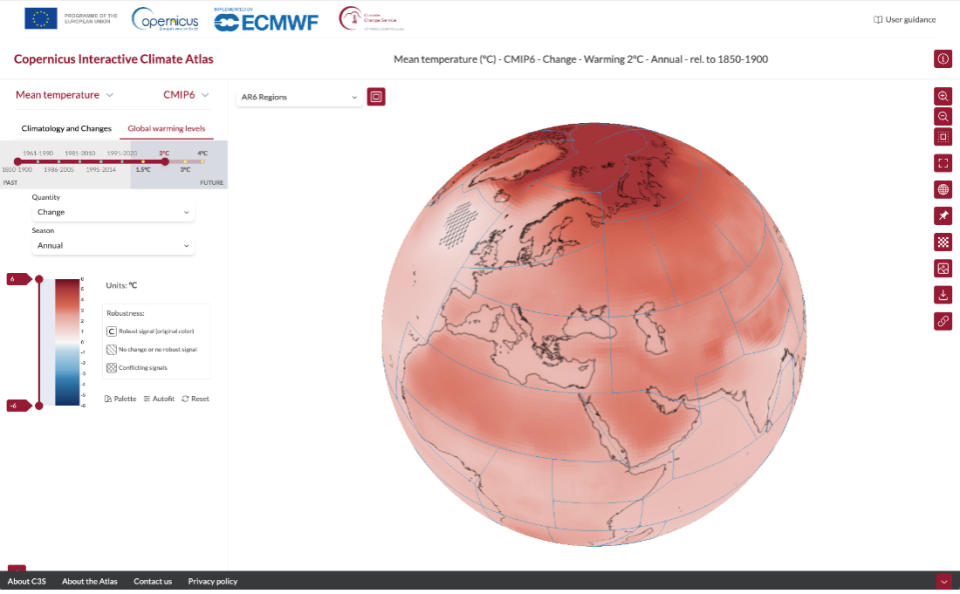
The landing page of the Copernicus Interactive Climate Atlas (C3S Atlas) shows a mean temperature increase for a 2° global warming relative to the pre-industrial baseline (1850-1900). Credit: European Union, Copernicus Climate Change Service
30 variables and indices
The C3S Atlas includes 30 basic variables and indices, which can help scientists and policymakers understand what the climate is like now, and what the future might hold. For example, users can refer to the Atlas to examine different scenarios, such as what could happen if the world gets warmer by 1.5, 2, 3, and even 4 degrees Celsius.
The Atlas also contains different datasets about the past. It includes observations like the E-OBS gridded observational database, which tracks the temperature in Europe since 1950. It also offers reanalyses from ERA5 and ERA5-Land, which give climate information from as far back as 1940 for ERA5 and 1950 for ERA5 Land, up to 2022.
The ORAS5 ocean reanalysis from 1958 to 2014 supplies data for the oceans.
Nine indices and variables not featured in the IPCC-IA were added. These focus on the "wet and dry," "wind and radiation," and "circulation" aspects of the climate. You can explore all of the included variables here.
Go global or local
One standout feature of the C3S Atlas is its use of new Regional Climate Model (RCM) information from two specific datasets: CORDEX-CORE and CORDEX-EUR-11.
CORDEX-CORE data presents a high-resolution view of the globe as a mosaic, focusing on land areas. It shows how climate patterns shift in different regions, even at the city level. CORDEX-EUR-11 zooms in even further, providing detailed information about Europe, with a resolution of 12.5 kilometres.
Another new feature of the Atlas is that users can draw their own boundaries on the map instead of being limited to predefined areas like countries or larger continental areas.
The regularly updated combination of data means that the C3S Atlas can empower researchers, policymakers, and anyone interested in climate science to explore and analyse climate data in unprecedented detail, both globally and locally.
Climate and seasonal stripes
The C3S Atlas also offers versatile visualisation tools for exploring climate data.
Through climate stripes, they can customise climate projection time series data to show the projections from different models for a particular area and time period. Each coloured stripe can be used to represent the temperature of each year in the time series compared with the long-term average, with cooler years shown in blue and hotter years in red.
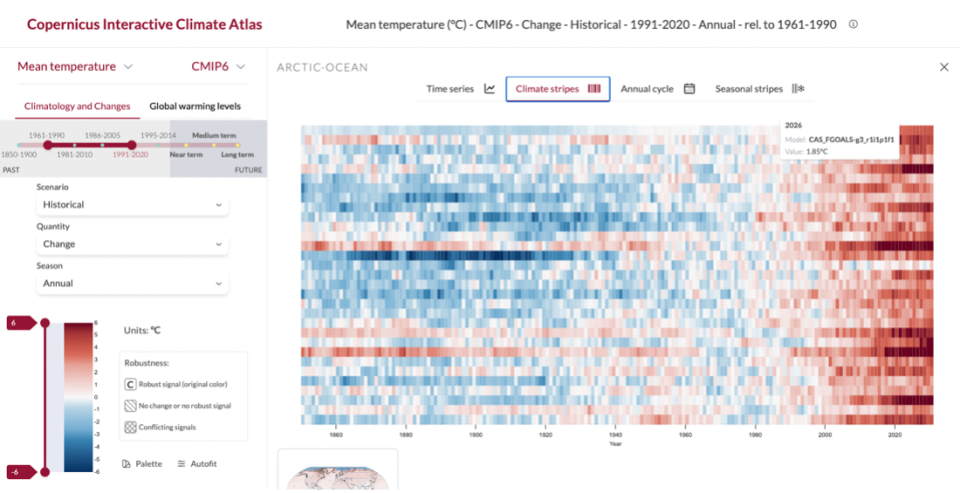
The climate stripes obtained from the climate projections provide detailed information about the data of each ensemble member (model). Credit: European Union, Copernicus Climate Change Service
Seasonal stripes are similar to the well-known climate stripes, but instead of including all the models, they show monthly values on the vertical axis.
Time series
This tool shows the values from all available models for a particular variable across a chosen region. It also indicates selected reference and baseline time periods. The variation among models is depicted by shading: darker shades represent where half of the models fall within a range of values.
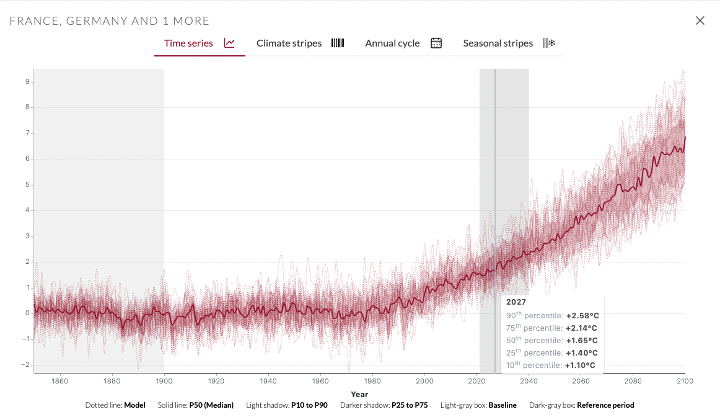
For the projection timeseries of CMIP5, CMIP6, CORDEX-CORE and CORDEX-EUR-11, the C3S Atlas provides the median and percentile data of the different ensemble members (models). Credit: European Union, Copernicus Climate Change Service
Accurate and reliable information
The C3S Atlas team has meticulously ensured the reliability and accuracy of all data within the Atlas through rigorous quality control measures. This helps policymakers make informed and science-based decisions rooted in the best and most reliable climate information available. "We are excited about the possibilities that the Copernicus Interactive Climate Atlas offers. With its expanded scope, which is aligned with future C3S and IPCC requirements, and its intuitive, accessible interface, the C3S Atlas will give users access to quality-assured climate information. This represents another important step towards the operationalisation of climate services in support of their growing role in informing the international climate adaptation and mitigation effort,” said C3S Director Carlo Buontempo.
You can find all the details on practical navigation in the C3S Atlas in the comprehensive User Guide.
More information
- Copernicus Interactive Climate Atlas: a game changer for policymakers
- Copernicus Interactive Climate Atlas: guide to the powerful new C3S tool
Source
Copernicus Observer. (2024, April 17). Discover the Copernicus Interactive Climate Atlas – a new guide for understanding the climate.