Gepubliceerd op 23 juni 2022
Methane has a mixture of both natural and anthropogenic sources. Around 40% of methane emissions comes from natural sources, while 60% comes from anthropogenic sources such as agriculture, fossil fuel exploitation and landfills.
One of the largest sources of methane emissions comes from wetlands – an area of land that is either covered by water or saturated with water – yet there is still uncertainty in how they respond to changes in climate and short-term variations, such as the El Niño-Southern Oscillation.
The combination of methane’s high global warming potential and relatively short lifetime in our atmosphere of approximately nine years, means if we reduce our methane emissions, we can partially mitigate the human impact of climate change on a relatively short timescale – while global emissions of carbon dioxide are reduced.
In situ methane measurements from 2020 showed the largest annual increase of methane concentrations since the 1980s, with this record surpassed in 2021. The year of 2020 was unique owing to the global pandemic, yet methane concentrations continued to rise despite a reduction in economic activity. Anthropogenic emissions of methane have contributed to an additional 23% to the radiative forcing – a direct measure of the amount of Earth’s energy budget that is out of balance – in the troposphere since 1750.
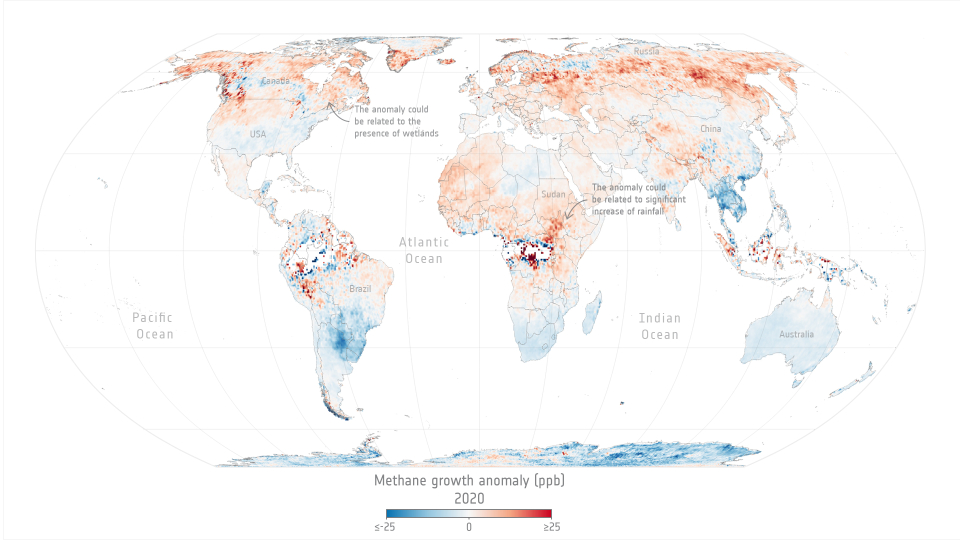
This global map shows the annual increase of methane emissions relative to the global mean annual increase and has been created using data from the Copernicus Sentinel-5P satellite.
It is not fully understood what is driving the recent trends in global methane concentrations owing to the uncertainty surrounding the sources and sinks. This is why it is important to monitor changes in atmospheric methane using satellites such as Copernicus Sentinel-5P. The satellite maps a wide range of pollutants such as nitrogen dioxide, ozone, formaldehyde, sulphur dioxide, carbon monoxide, and of course, methane.
Using observations obtained from Sentinel-5P, the team found that satellite measurements show the same increase of methane as demonstrated in surface measurements. Using the global coverage capability of Sentinel-5P, the team identified regions which showed large increases throughout 2020.
These regions include South Sudan and Uganda in Central Africa, along with high-latitude northern regions including Canada and Russia. During 2019, emissions related to large positive rainfall anomalies from Sudd wetlands in South Sudan were found to be over a quarter of the growth in global emissions.
Read the rest of the article
over on ESA's Observing the Earth website