Gepubliceerd op 15 maart 2022
A new satellite-derived dataset links concentrations of fine particulate matter in air pollution with health outcomes in cities around the world.
Air pollution is the fourth leading risk factor for death around the world. But one type of pollutant is particularly harmful: fine particulate matter (PM2.5). These small, inhalable particles (less than 2.5 micrometers in diameter) result from direct emissions into the air, as well as interactions among other pollutants. PM2.5 is the leading cause of death among air pollutants, contributing to cardiovascular and respiratory disease and millions of premature deaths worldwide each year.
In a new study covering urban settlements worldwide, researchers found that PM2.5 concentrations and associated mortality declined in some areas due to reductions in precursor pollutants (such as oxides of sulfur and nitrogen) after the passage of clean air laws. However, the global average mortality rate attributable to PM2.5 remained relatively stable from 2000 to 2019.
“That’s the global average,” said Susan C. Anenberg, an associate professor of global health at the George Washington University, “and that really masks very different dynamics happening depending on where you are in the world.”

The study by Anenberg and colleagues is one of a pair of NASA-funded studies, published in The Lancet Planetary Health in January 2022, that provide estimates of the burden of disease from air pollution in more than 13,000 urban areas around the world. The first study focused on nitrogen dioxide (NO2), which is a precursor to PM2.5. In both studies, the teams combined two decades of satellite observations with health data from the Global Burden of Disease study, a comprehensive study on health, risk factors, disease, and death in 204 countries since 1990.
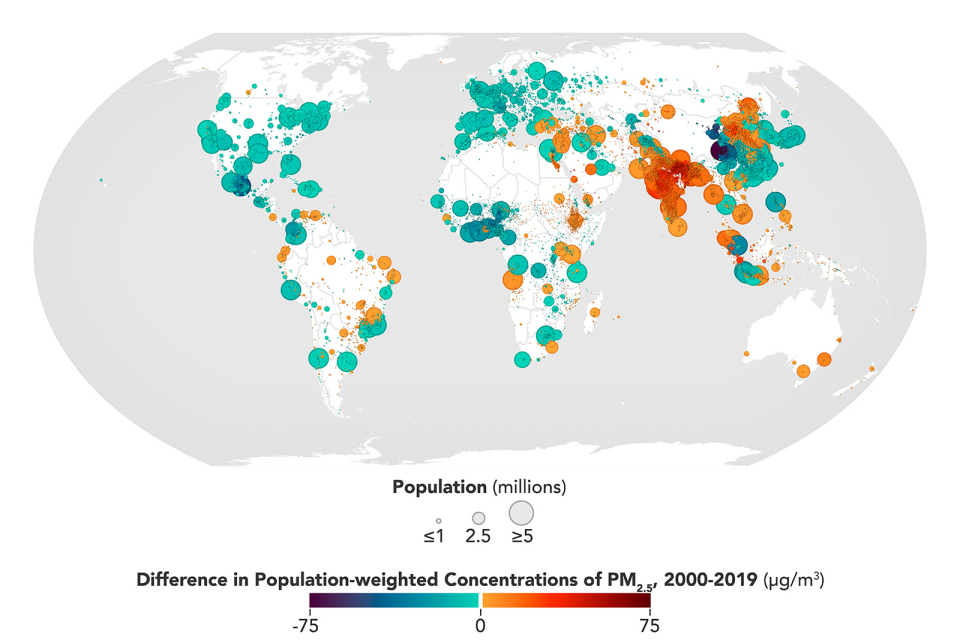
The maps above show the changes in PM2.5 concentrations and mortality for urban areas around the world between 2000 and 2019. The first map shows absolute change in PM2.5 concentrations weighted by population. The second map shows the percentage change in PM2.5-attributable mortality rates per 100,000 population. Cities in Southeast Asia saw some of the largest annual average increases in both metrics.