Published on 2 August 2021
Malaria causes more than 400.000 deaths annually, most of them in sub-Saharan Africa. For rural populations, the risk is well known, but the disease also affects cities. The objective of the STEREO project REACT was to improve our understanding of malaria risk, to map it within cities and to compare results across cities.
Neighbourhood-scale models
The project, which has just been completed, has developed a detailed spatial model (100 m grid) of urban malaria prevalence, which has been mapped for two very large cities in sub-Saharan Africa: Kampala (Uganda) and Dar Es Salaam (Tanzania).
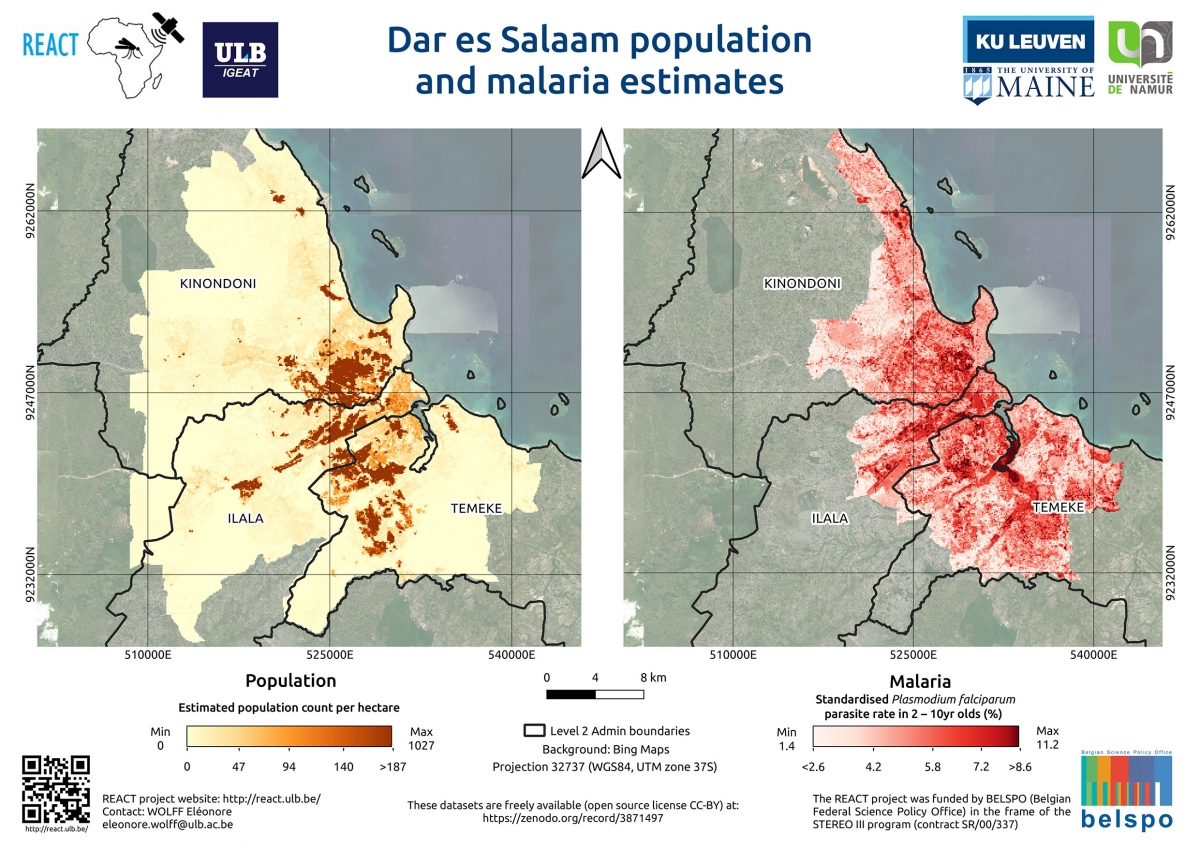
Left, population density map; right, malaria prevalence rate for Dar Es Salaam, Tanzania
To calculate the prevalence of a disease in such detail, it is necessary to have a fine mapping of the population. An intermediate model is used to improve the knowledge of the spatial distribution of the population based on land use and occupancy maps derived from very-high resolution satellite images and geographical data from the OpenStreetMap database.
Including socio-economic level
Zooming in on the risk map reveals higher risks in agricultural areas, usually located on the outskirts of the city, but also in deprived urban areas, commonly referred to as informal settlements or 'slums'.
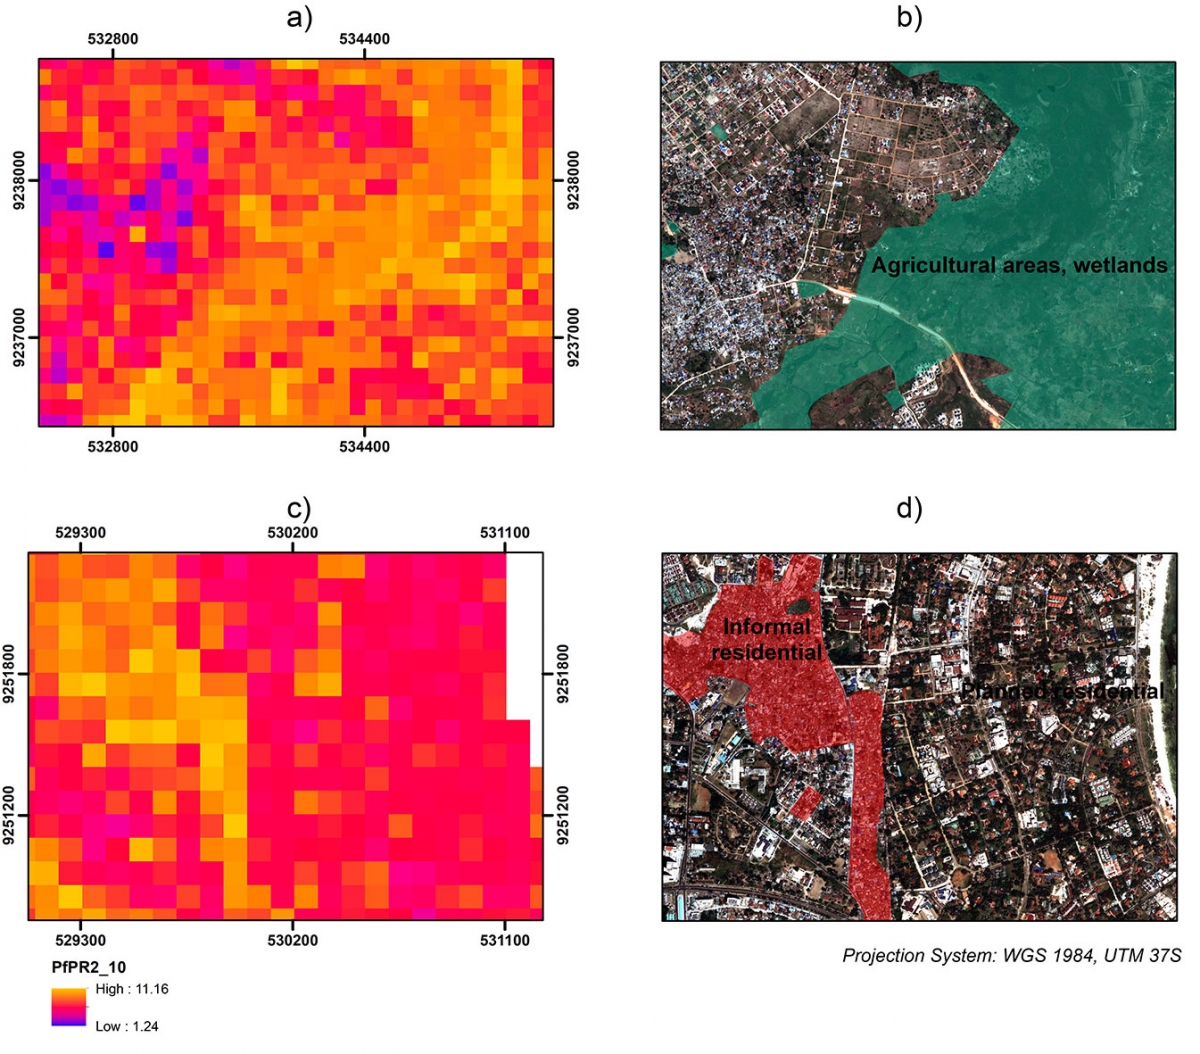
Estimates of malaria prevalence at 100 metre resolution in Dar es Salaam, Tanzania. a,b) in peri-urban agricultural areas and c,d) in informal and formal settlements.
In these neighbourhoods, the absence of water and waste disposal systems locally blocks rainwater runoff and even streams, causing puddles and floods that become breeding grounds for malaria-carrying mosquitoes. Similarly, the lack of a water supply system forces people to store rainwater in uncovered containers which are also potential breeding grounds.

Area prone to flooding in Pikine, a densely populated city in the Dakar region, Senegal. Standing waters appear nearly black on the Pleiades false colour infrared band combination. They provide breeding sites for mosquitoes, including those that can carry malaria.
Another important result of the project was the modelling of the socio-economic level of households based on survey data and geographical data from Earth Observation (altitude of buildings, presence of swimming pools, etc.) or existing databases (altitude, roads, etc.). For Dakar (Senegal), the graphs below clearly show that areas with a higher proportion of swimming pools are positively associated with household wealth, while disadvantaged areas, where the most vulnerable population resides, are negatively associated with household wealth.

Partial associations between EO-derived indicators and household wealth in Dakar calculated by a Random Forest algorithm.
...and urban climate
Malaria risk modelling has also benefited from urban climate modelling. 9 cities in Sub-Saharan Africa have been mapped according to a recent standardised land use and land cover classification (Local Climate Zones) with a high number of classes (10 urban and 7 natural). RADAR and optical satellite data were used to perform the mapping following and further developing the mapping framework detailed on the WUDAPT access portal.
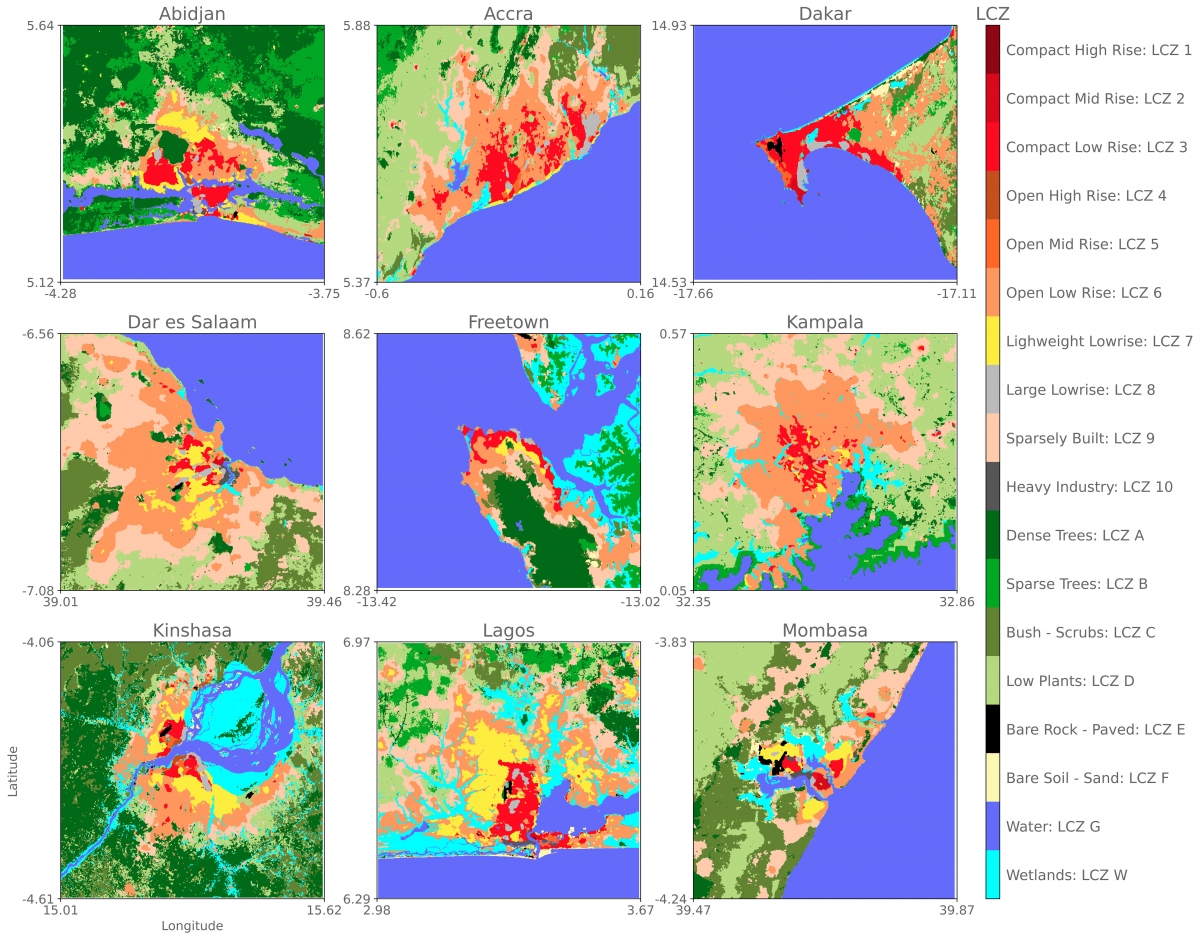
Local Climate Zone classifications for 9 cities in Sub-Saharan Africa according to the Local Climate Zone (LCZ) legend.
Local Climate Zones were utilized to improve the intra-urban climate model of Kampala using a regional climate model (COSMOS-CLM). The results show that the impact of recent and rapid urbanisation (from 2000 to 2017) is expected to have contributed to a significant increase in the intensity of the urban heat island by up to 2°C and a drying of the urban environment. The urban area is also expected to alter local air mass circulations between the city and the lake.
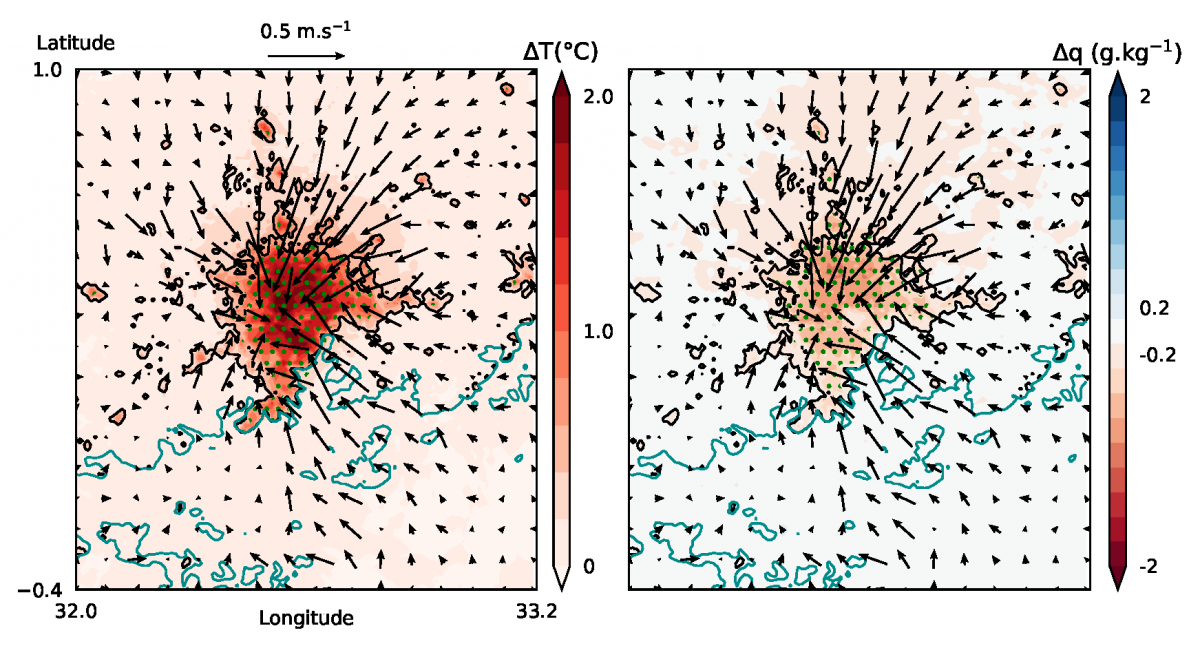
Impact of recent urbanisation on local climate in the Greater Kampala urban area (black line) on air temperature at 2 m (left) and specific humidity (right). Wind speed and direction anomalies are represented by the black arrows. The lake shoreline is shown in turquoise. Green dots indicate statistically significant changes
More information
STEREO project REACT (REACT - Remote sensing for Epidemiology in African CiTies)
REACT: Fighting infectious diseases with the help of Earth Observation