Published on 20 January 2023
Biomass production by chlorophyll-containing plants is the basis of the food chain and therefore of life itself. Photosynthesis is therefore a fundamental ecosystem service made to society. The quantification of gross primary productivity, i.e. the amount of CO2 assimilated through photosynthesis by terrestrial ecosystems, is therefore of essential importance and determines in large part the seasonal variability of the terrestrial carbon cycle.
|
Gross primary productivity (GPP) is the total amount of carbon compounds produced by photosynthesis of plants in an ecosystem in a given period of time. Net primary productivity (NPP) is the amount of carbon retained in an ecosystem (increase in biomass); it is equal to the difference between the amount of carbon produced through photosynthesis (GPP) and the amount of energy that is used for respiration (R). Source: UN-REDD Glossary |
New products to deal with variability
Land Surface Models (LSMs) and Earth Observation (EO) products have proven to be good tools for describing the global patterns of GPP, but they both showed limitations in capturing the existing huge variability across and within biomes.
The STEREO III project ECOPROPHET aimed at improving global GPP estimates by developing more efficient models. To this end, the team, composed of researchers from the University of Antwerp, the Royal Meteorological Institute, Peking University and the Laboratoire des Sciences du Climat et de l'Environnement (France), investigated to what extent the multitude of new EO products are good proxies of ecosystem photosynthetic activity and leaf phenology, and evaluated the performance of three land surface models (ORCHIDEE, SURFEX, LSA-SAF), after reconfiguration of their parameters.
Indicators related to the functioning of plants
The results of the ECOPROPHET project highlighted the following points:
- vegetation indices derived from Sentinel-2 data are suitable descriptors of the ecosystem phenology. Among all investigated vegetation indices, chlorophyll-sensitive indices (e.g., terrestrial chlorophyll index) showed the best fit with GPP and leaf phenology;
- the inclusion of soil moisture into linear models between GPP and vegetation indices clearly improves GPP estimates during drought conditions;
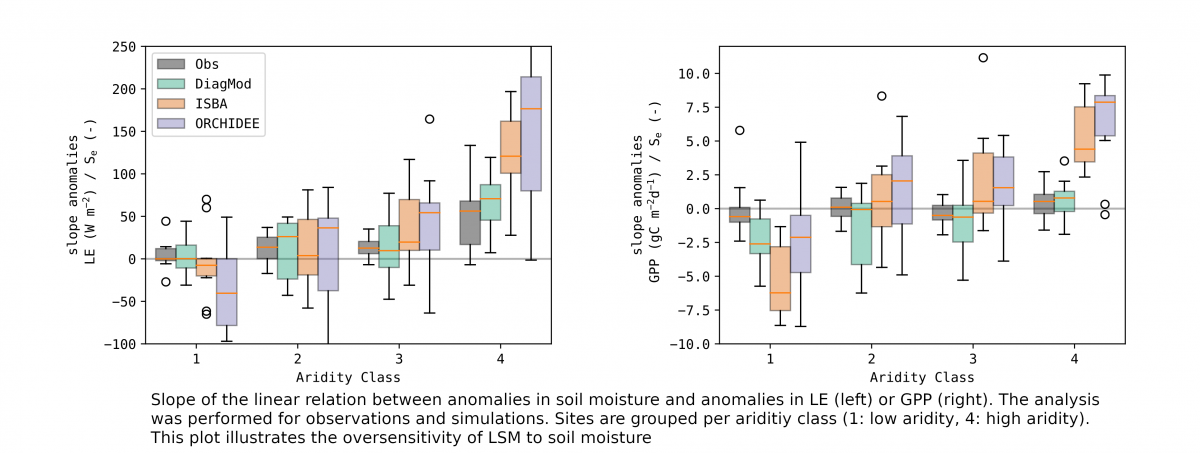
- GPP in some land surface models (both ISBA and ORCHIDEE) was too sensitive to drought stress, compared to observations, and errors in the surface fluxes were strongly correlated to errors in leaf area index (LAI);
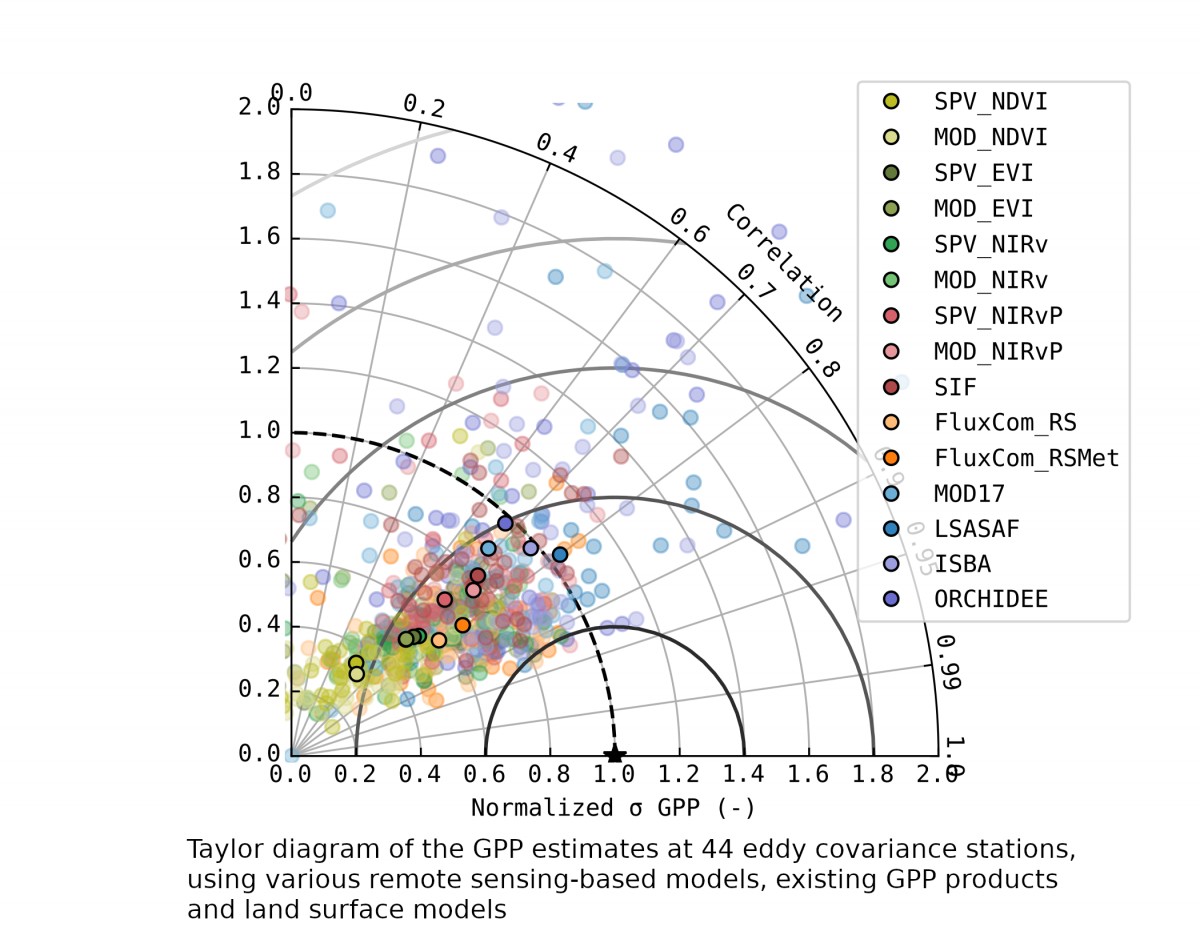
- simple satellite-based models accurately simulate mean seasonal GPP, but they fail in capturing the inter-annual variability and timing of the seasonal cycle. In contrast, land surface models are able to capture seasonal anomalies in GPP, but have trouble simulating the associated leaf phenology. The LSA-SAF algorithm, which relies on external information for soil moisture and leaf are index (LAI), performs quite well compared to the more sophisticated ORCHIDEE and SURFEX modelling.

Research conducted within the ECOPROPHET project allowed the identification of a series of elements that are key to refining existing models.
Thus, future researches should further explore the role of satellite-based soil moisture observations as a potential tool to better understand and assess the effect of drought on GPP. It should also focus on improving the feedback mechanism between GPP and LAI (i.e., the biomass allocation scheme) as a central element to improve the intricate coupling between energy, water, and vegetation in land surface models.
