Published on 27 September 2022
In sub-Saharan Africa, with the rapidly increasing pace of urbanisation, cities lack the capacity to respond to the demand for affordable housing and services. Consequently, spontaneous deprived areas (‘slums’) proliferate. According to UN-Habitat, about 60% of city dwellers in Africa live in slums, but estimating demographic measures may prove arduous as communities are most often not reflected on maps or in official data. Spatial data are sorely needed by international organisations, authorities, and NGOs for taking stock of the situation and targeting efforts to improve living conditions. Slum dwellers too want to be on the map to be fully recognized as citizens and have their say.
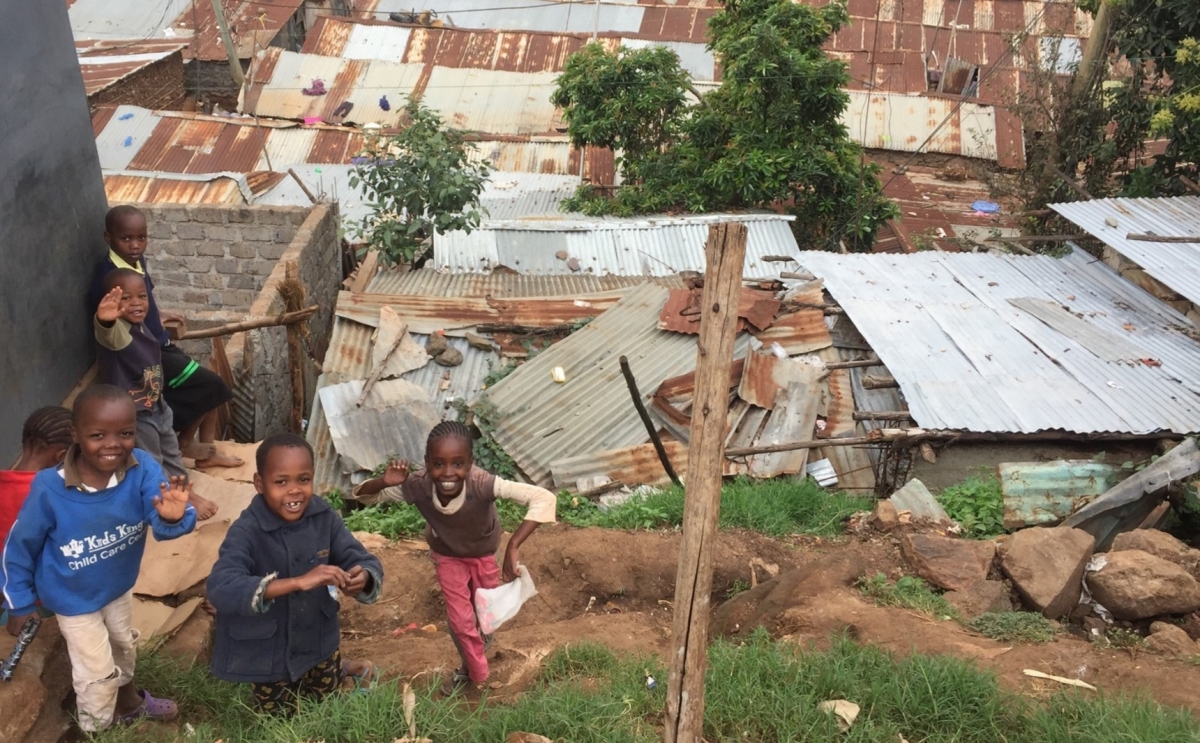
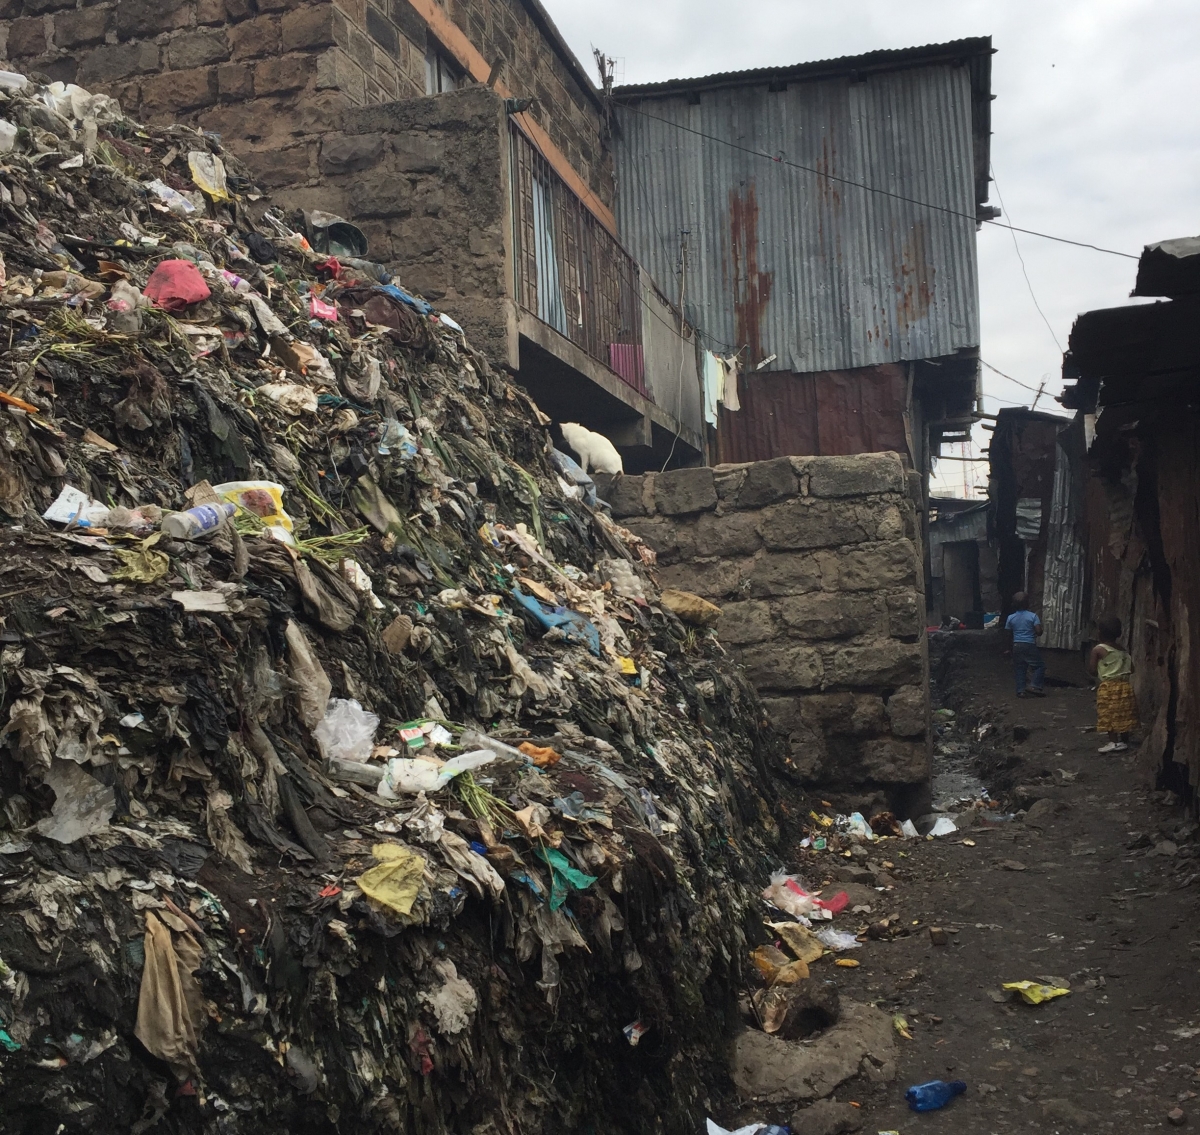
Children in Mathare slum, Nairobi, Kenya.
|
The main objective of the STEREO III SLUMAP project is to develop RS-based methods for modelling the location, extent and characteristics of deprived urban areas, with an emphasis on scalability and transferability, in order to contribute to Sustainable Development Goal 11 "Make cities and human settlements inclusive, safe, resilient and sustainable". The results are usable at many levels, from local people and field NGOs to international institutions and local and national governments. |
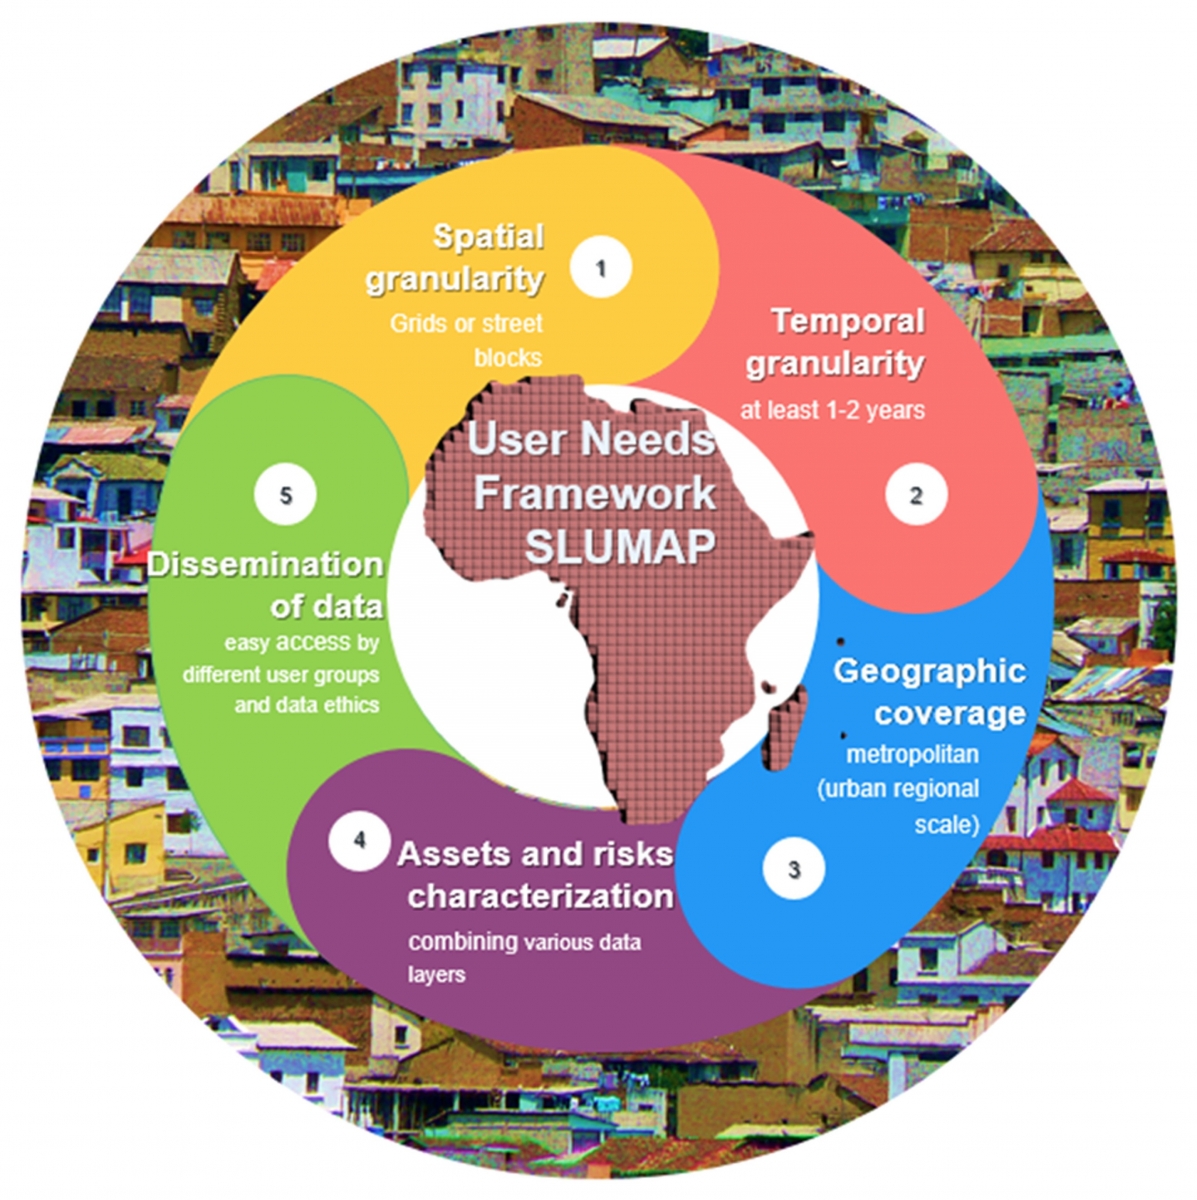
Working together to identify the needs
The objective of the STEREO III SLUMAP project (Remote Sensing for Slum Mapping and Characterization in sub-Saharan African Cities) was to develop an open-source framework and models for processing Earth Observation (EO) imagery to map the location and extent of deprived areas and extract their fine-scale characteristics.
The team, composed of members of the Free University of Brussels and the University of Twente (ITC), first assessed users' requirements for spatial information on urban deprivation. The data accessibility, up-to-dateness, aggregation and ethics/privacy were analyzed. Indeed, it is necessary to avoid that the maps be used against the communities (for example in the case of land tenure conflicts or forced evictions). Three cities with contrasting properties were selected as case studies: Nairobi and Kisumu in Kenya (Kisumu as an example of a secondary city) and Ouagadougou in Burkina Faso.
|
|

Highlighting deprived areas on city maps
The wide diversity of deprived areas, both across cities and within the same city, makes it challenging to design generic city-scale models. To this aim, the project team used publicly available building footprints and Copernicus Sentinel-1 and 2 satellite data and designed a mixed unsupervised/supervised machine-learning workflow (see inset). The developed models capture the morphology of urban deprivation in gridded maps (100m x 100m) and can be applied to cities featuring different urban forms. Since deprived areas are likely to have fuzzy, morphing borders, and for ethical reasons, the citywide maps show a ‘morphological deprivation probability’ instead of the binary slum vs. non-slum paradigm.
|
Machine learning is a field of artificial intelligence that uses mathematical and statistical approaches to give systems the ability to learn from data to make predictions, and to self-improve on the basis of experience. It can handle large volumes of data and reduces human intervention. |
 |
||
 |
 |
 |
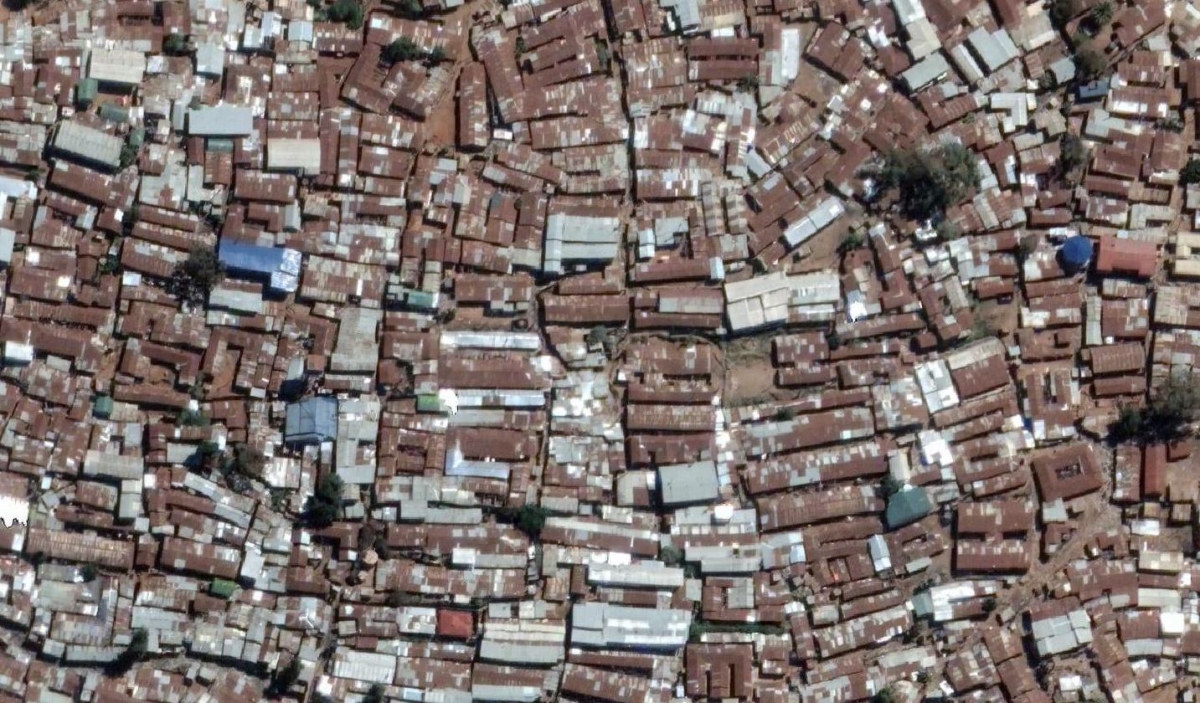
Top: Morphological deprivation probability (100m x 100m). Bottom: Examples of deprived area morphologies in Ouagadougou (left), Nairobi (centre) and Kisumu (right).
Zoom in: mapping and characterising deprived areas
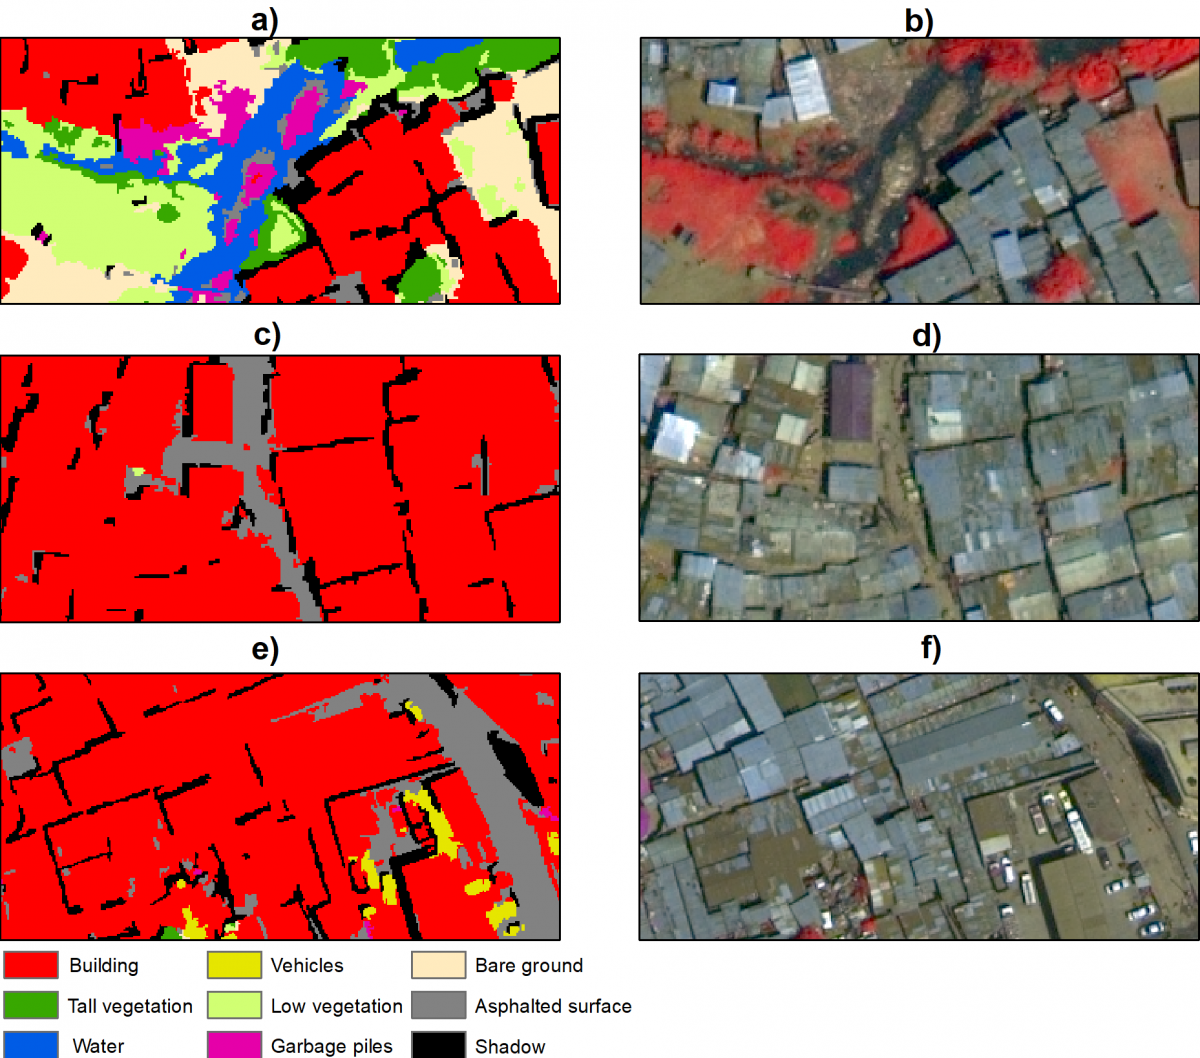
The team mapped deprived areas in great detail with very-high resolution imagery, using an OBIA (Object-Based Image Analysis) / machine learning approach. The principle of OBIA analysis is to decompose the image into objects corresponding to the different elements that compose it and then to classify these objects on the basis of their shape, their size and their spatial and spectral properties.
To date, very high resolution imagery is still expensive, but the project showed that even the baseline RGB bands can be used to map the urban fabric and rarely mapped elements, such as solid waste piles and vehicles. The models developed by the project are open and transferable across deprived areas within a city. The team computed indicators from the fine-scale maps and combined them with others derived from imagery and open layers to characterise deprived areas in terms of land cover, urban morphology, environment, and topography.
 |
 |
 |
|
Top left: Detailed land-cover within slums. Bottom: Solid waste density indicator (100m x 100m), Mathare slum, Nairobi.
The power of combining EO with citizen science
In the associated support project PARTIMAP, the team designed and implemented a citizen science process to capture deprivation perception and investigate how it relates to the urban appearance visible on satellite imagery, and other spatial indicators. Nairobi slum dwellers used a mobile app to vote for ‘the best place to live’ among pairs of satellite image chips. Based on more than one million votes and using deep learning techniques applied to satellite imagery, the team was able to derive a deprivation perception score. With machine learning, spatial indicators that have a strong influence on perceived deprivation severity were also identified.
 |
|
 |
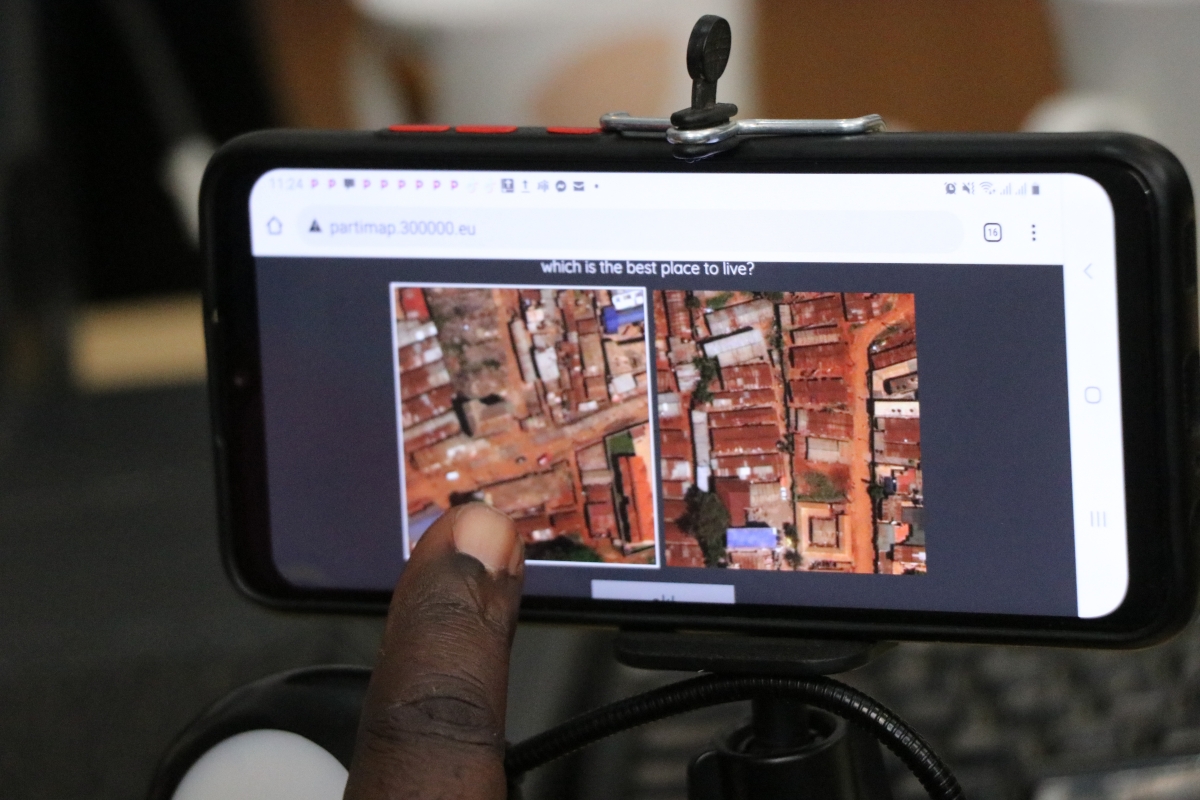 |
Top: Deprivation perception score. Bottom left: Training slum dwellers in satellite image interpretation. Bottom right: Mobile app for collecting votes.
The outputs of the SLUMAP project are valuable tools to support pro-poor evidence-based policies based in view of progressing towards the Sustainable Development Goals.