Published on 22 July 2019
When the mercury skyrockets, as it's doing this week, city dwellers seek coolness in parks and forests or, when they can, escape to greener areas.
It's something we all know instinctively: the hearts of cities can get the hottest in summer. This so-called urban heat island effect is explained by the replacement of soils covered with vegetation and pervious materials by buildings and impervious surfacing.

A. Average urban heat island during the summer months at 23 o'clock between 1996 and 2015
|
Why is it hotter in cities
|
The SmartPop project, financed in part by the STEREO III programme, aims to analyse and predict the evolution of urbanisation and population in Wallonia in order to better estimate the risks to which inhabitants might be exposed: risks like floods, air polution and heat waves.
The SmartPop team also estimated the occurence and the intensity of urban heat islands (and thus the exposure of the population to thermic stress) in the city of Liège, both in current (1996 – 2015) and future (2081 – 2100) climatic conditions.
Based on the fact that mean air temperatures have been rising steadily in the city centre over the course of the past twenty years (from 1996 to 2015), the team can confirm that the city centre of Liège experiences temperates 4° higher than what was found in the surrounding countryside, even after having corrected for elevation.
According to climatic models, the average temperature of the Earth's surface will rise with 1.5° between 2026 and 2045 and with 4.5° by the end of the century. These numbers might not sound alarming to some people. Such a temperature increase would however have serious detrimental effects on public health. To illustrate this, the SmartPop team calculated the number of heatwave days per year Liège inhabitants would be exposed in the future, noting that mortality rates are significantly higher during such days.
According to the FPS Public Health, a heatwave day is any day where the 3-day average maximum temperature exceeds 30°, and the 3-day average minimum temperature exceeds 18°.
|
B. Average number of heat wave days per year for Liège and surroundings between 1996 and 2015. |
C. Estimated number of heat wave days per year for Liège in the period 2026 – 2045, according to the RCP8.5 scenario of radiative forcing established by the IPCC. |


|
D. Estimated number of heat wave days per year for Liège and surroundings for the period 2081 – 2100, according to the RCP8.5 scenario of radiative forcing established by the IPCC. |
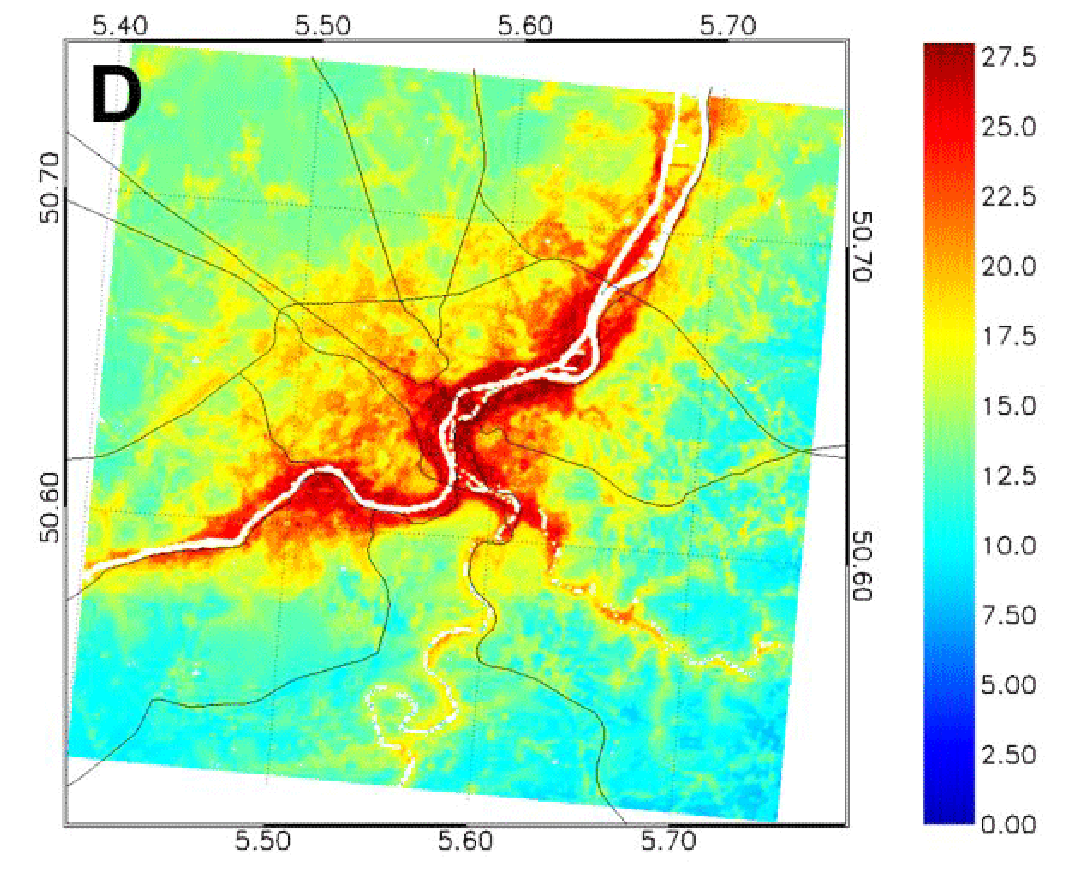
The illustrations above show the expected evolution of the number of heat wave days in Liège and the surrounding region until the end of the century. At this moment, the inhabitants of the city centre face on average 5 heatwave days per year, compared to 1 to 2 heatwave days in the countryside. These numbers will double by 2050, and will quintuple (increase fivefold) or more by the end of the century! In other words, if we continue on this trajectory, without reducing greenhouse gas emisions our grandchildren will experience summer months made up for 30% of heat wave days if they live in the city, with considerable impacts not just on their health, but also on the productivity, the energy consumption and infrastructure failure.
More information:
What is an Urban Heat Island? - NASA Climate Kids
Focus: Ilôts de chaleur - Bruxelles Environnement
Focus: Warmte-eilanden - Leefmilieu Brussel