Image processing


Contrast and filtering
Contrast enhancement
Improving the picture by turning up the contrast
Most digital image display systems allow one to break each ‘primitive’ colour into 256 degrees of intensity. An image that uses this entire intensity scale, that is, that contains values coded from 0 to 255, has excellent contrast, for the colour range will extend from black to white and include fully-saturated colours. In contrast, an image that uses a narrow range of numerical values will lack contrast (it will look ‘greyish’).
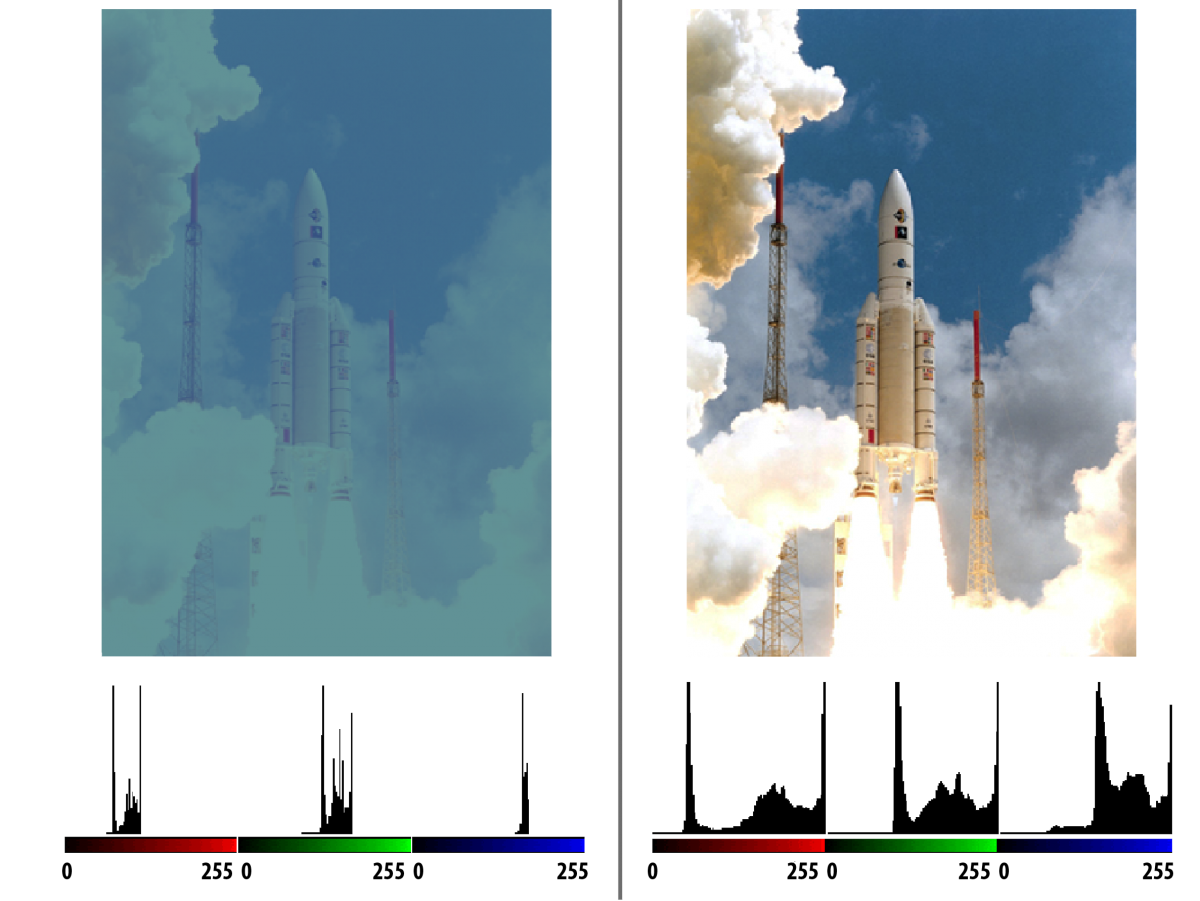
The top image is poorly contrasted, and the graphs show that the numerical values observed cover only a few dozen values in the red and green spectral bands and even fewer in the blue bland. These graphs also show that the blue and green values are higher overall than the red values. This explains the image’s blue-green cast. The picture at the bottom shows the result of applying a contrast spread function to the image. This involves changing the numerical values of the original image according to a linear function specific to each of the R, G and B components (V'R = kR * VR + cR) so as to make use of all of the possible values (0-255).
The contrast spread function is almost always applied before remote sensing images are analysed. This is because the Earth-observing satellites’ sensors are set to be able to record very different lighting conditions, ranging from deserts and ice floes (highly reflective areas) to Equatorial rainforests and oceans (very dark areas).
Filtering
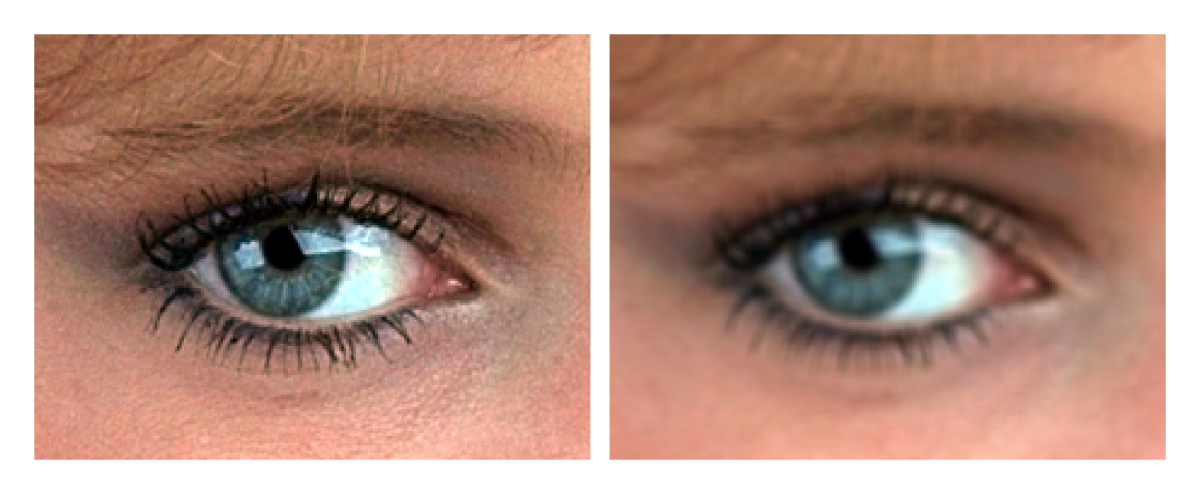
Filtering is an operation designed to improve images’ readability and/or to extract certain information from them. The principle of the various filters is to modify the numerical value of each pixel as a function of the neighbouring pixels’ values. For example, if the value of each pixel is replaced by the average of its value and those of its eight neighbours the image is smoothed, that is to say, the finer details disappear and the image appears fuzzier. In ‘mobile window filtering’ the programme computes for a given pixel the sum of the products of the neighbouring pixels’ values multiplied by coefficients given in a table of coefficients, then repeats the operation for the next pixel and so on.

This same mobile window has been applied to the three bands (red, green and blue) of the image on the left. The filtered result (to the right of the original) shows that many fine details (strands of hair, parts of the eyelashes, etc.) have disappeared and the image itself appears more blurred. This type of filtering, which eliminates small details, i.e., ones with high spatial frequencies, is also called ‘low pass filtering’.

The mobile window’s coefficients can also be adjusted to create filters that reveal specific directions in the image.
So, the values used in filter A enhance (in dark grey) the vertical boundaries seen in the image, whereas filter B enhances the horizontal ones. These effects are particularly noticeable at the edges of the eye’s iris.
Filters can also be used to reinforce the perception of an image’s sharpness. In the following example of a panchromatic (10m pixels) SPOT image of Brussels, the original image (to the left) was improved by applying a filter to enhance local contrast. The right-hand image clearly looks sharper, even though the processing did not actually add any information.
