Data acquisition


Remote sensing images
Remote sensing was one of the first disciplines based on analysing and using digital images and many image-processing techniques were developed under remote sensing projects. Today, digital images are everywhere and remote sensing accounts for only a tiny fraction of their uses.
Here are the fundamental characteristics of remote sensing images:
- spectral resolution
- spatial resolution
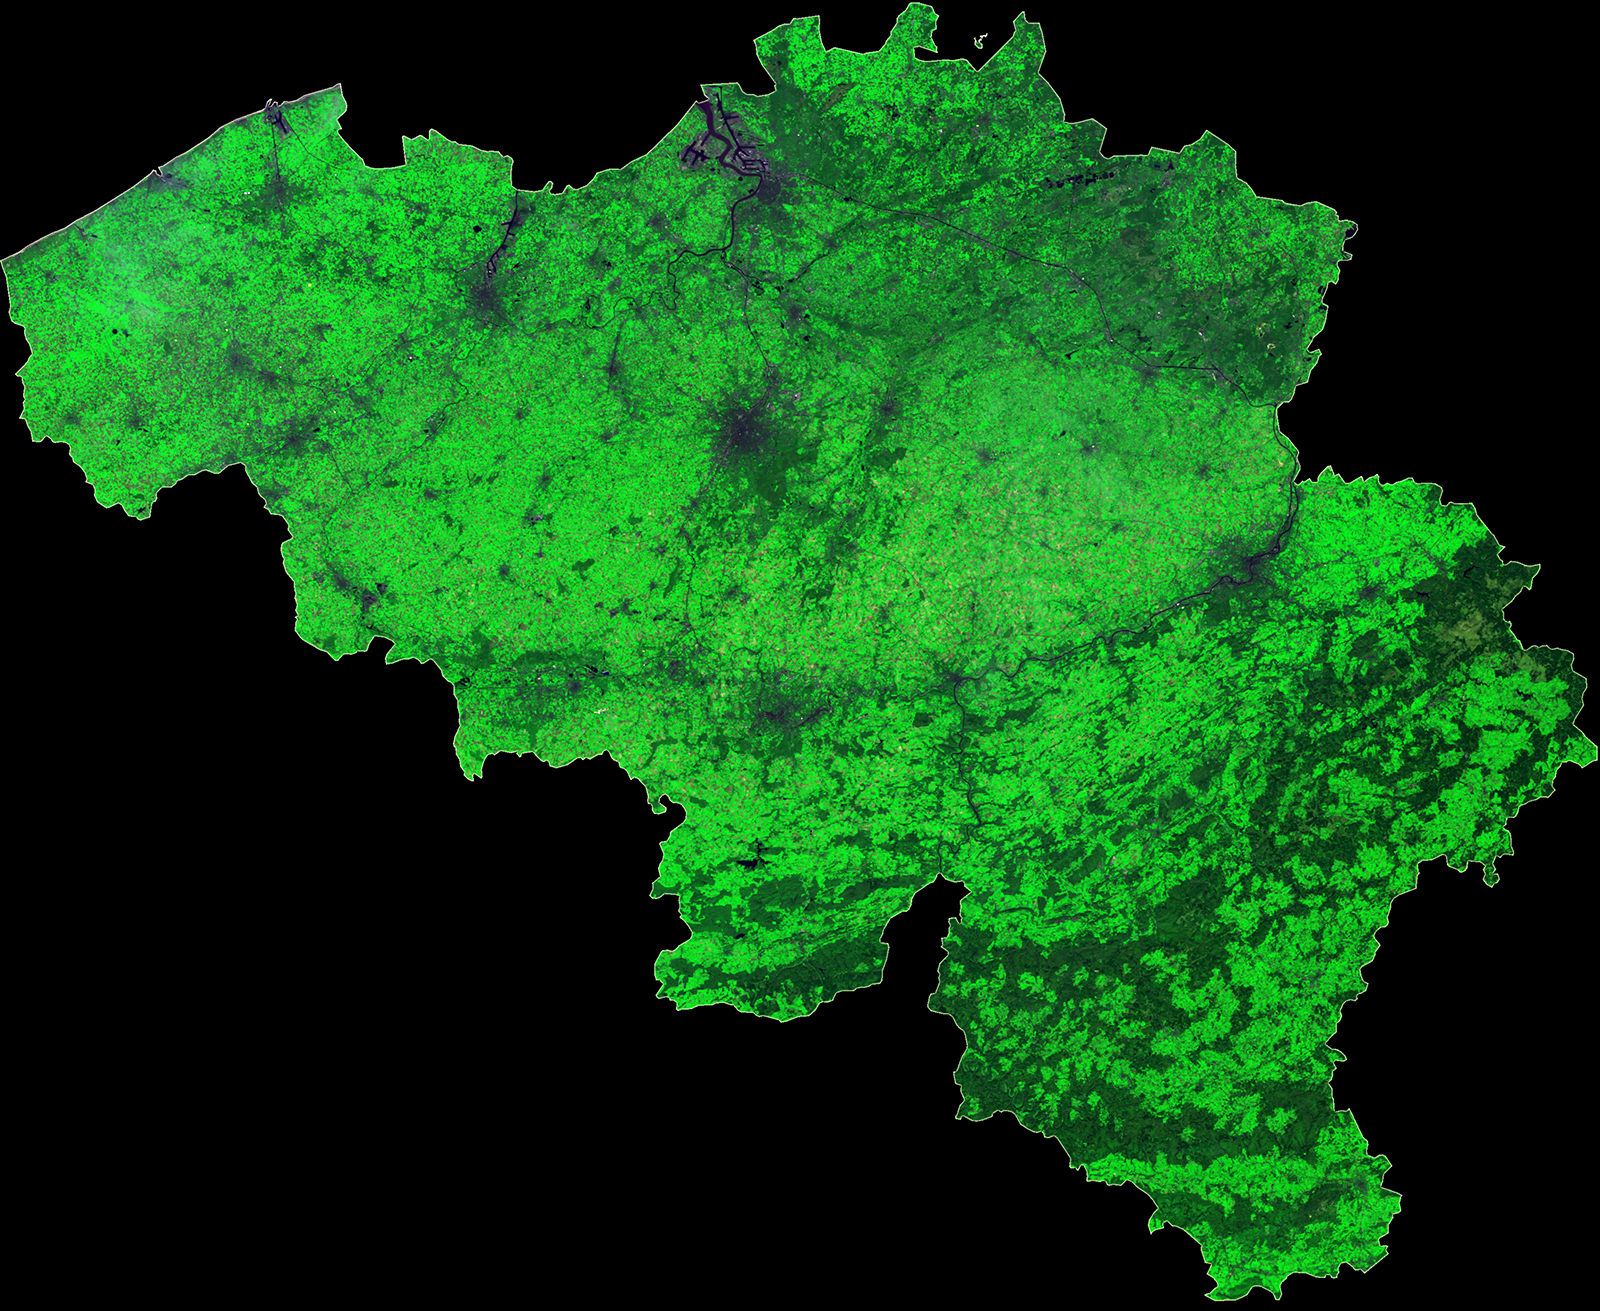
Belgium acquired by PROBA-V on 24/08/2016. This is a Top of Atmosphere (no atmospheric corrections applied) daily synthesis product (S1-TOA) at 1 km spatial resolution. ©ESA-BELSPO 2017, produced by VITO©ESA-BELSPO 2017, produced by VITO
Spectral resolution
Sensors aboard a satellite capture the radiation emitted or reflected by objects on the earth's surface in sensor specific wavelength interval.
The spectral resolution is the ability of a sensing system to resolve or differentiate electromagnetic radiations of different frequencies.The more sensitive a sensor is for small spectral differences (small wavelength intervals) the higher is its spectral resolution. Spectral resolution depends on the setting of the optical filter which splits the incoming electromagnetic radiation in smaller spectral bands.
Panchromatic images
Panchromatic images are obtained by recording radiation in a single wide bandwidth within the visible part of the spectrum, i.e. between 0.4 and 0.7 µm.
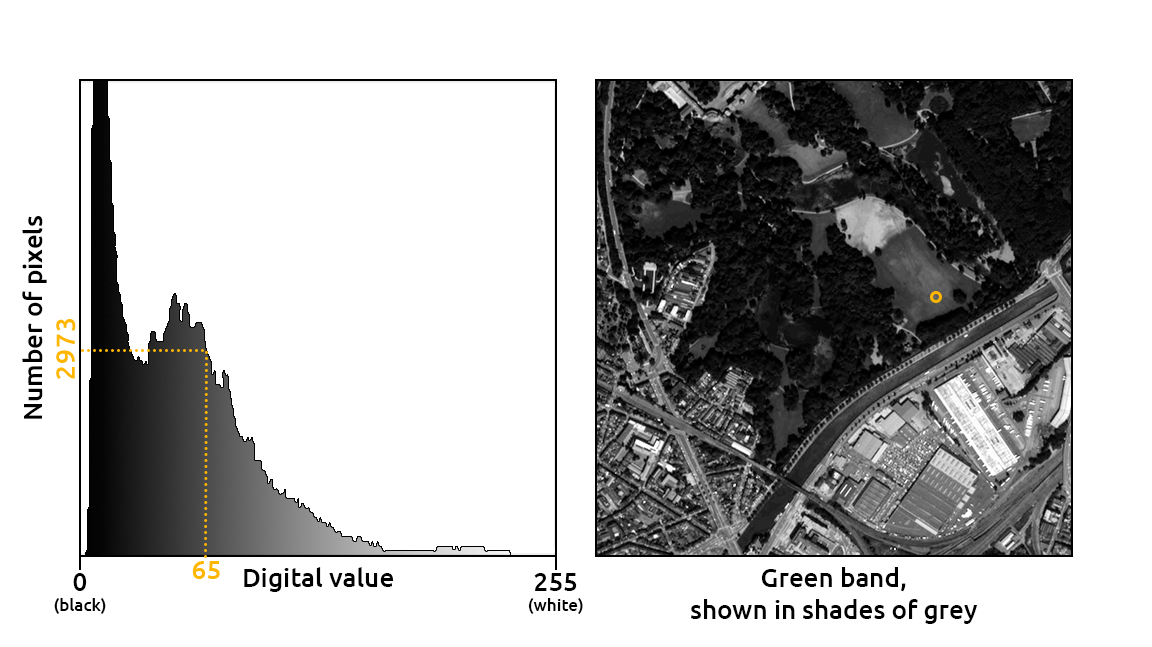
Because the data are stored in one single channel, only black and white images can be produced (for images coded in 8 bits, 256 greytones can be visualised).
The spectral information contained in a panchromatic image is rather limited, but such images generally have a higher spatial resolution.
Multispectral images
Multispectral data are acquired by simultaneously recording 3 to 8 different spectral bands that may or may not be contiguous.
To visualise this information as a colour image, primary colours (red-green-blue) are paired with spectral bands.
The relative brightness (which depends on its digital value) of each pixel in each primary colour band determines the resulting colour in the combined bands.
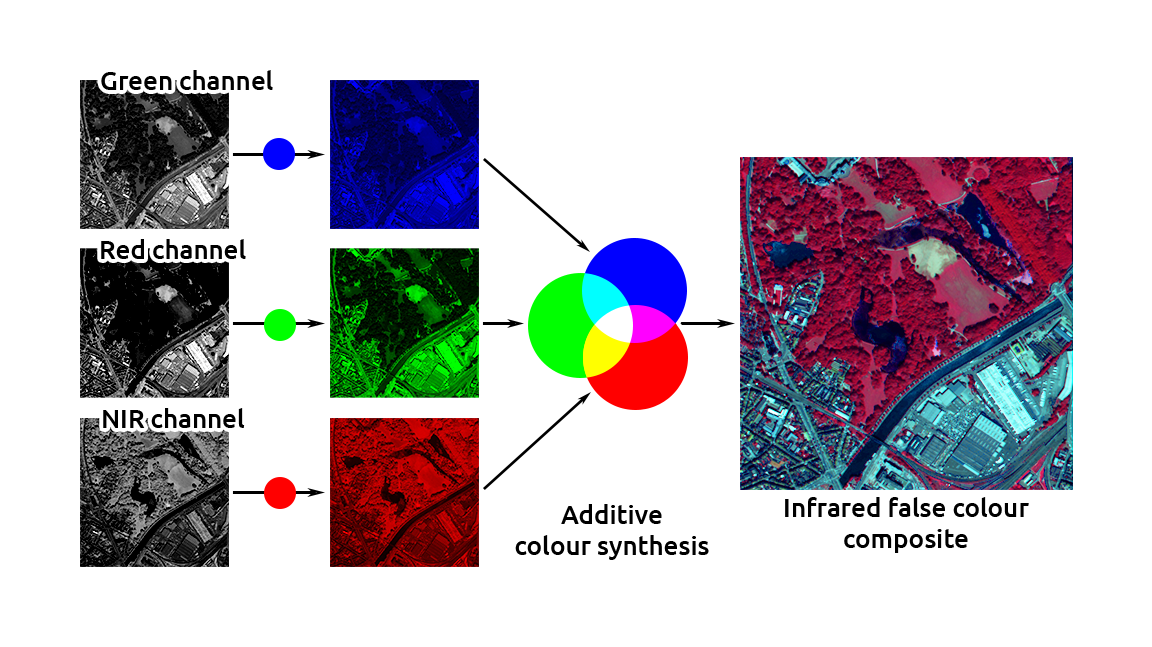
Visualisation of a Pléiades image as an infrared false colors composite
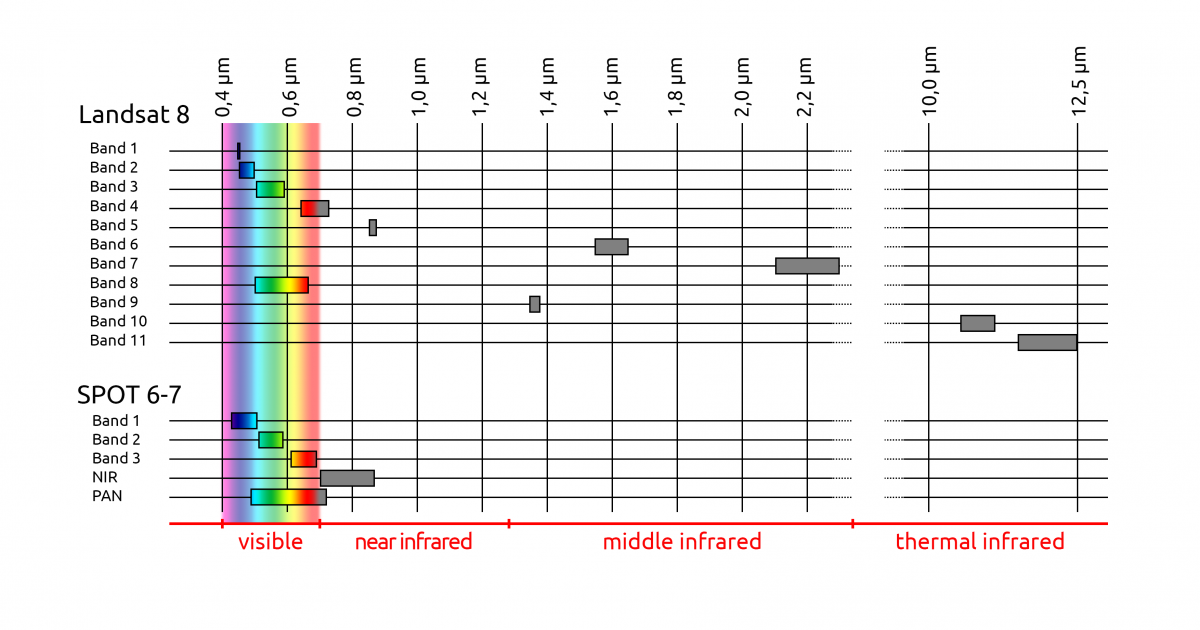
For example, the OLI sensor (Operational Land Imager) aboard Landsat 8 records 8 spectral bands in the 0.43 to 2.29 µm portion of the spectrum (4 in visible light, 1 in near infrared, 3 in mid infrared) in multispectral mode and 1 band in panchromatic mode, while the TIRS sensor (Thermal Infrared Sensor) records 2 spectral bands in the thermal infrared portion of the spectrum.
The NAOMI sensor on board Spot 6 and 7 satellites generates 4 spectral bands in multispectral mode:
- the blue band registers the part of the spectrum between 0.45 and 0.52 µm,
- the green band between 0.53 and 0.59 µm,
- the red band between 0.625 and 0.695 µm,
- the near infrared (NIR) band between 0.76 and 0.89 µm,
and one single band in panchromatic mode (0.45 - 0.745 µm).
Hyperspectral images (imaging spectroscopy)
Hyperspectral imagery is acquired by sensors which can sample a multitude (often more than 200) of spectral bands in the visible, near infrared and mid infrared range. In comparison with multispectral data, the bands are much narrower (a couple of nm order of magnitude) and are often contiguous.
Hyperspectral data provide more detailed information (a finer spectral signature) about an object thus allowing a more precise identification and discrimination.
Each pixel in a hyperspectral image contains the information sampled over wide windows within the visible and infrared parts of the electromagnetic spectrum.
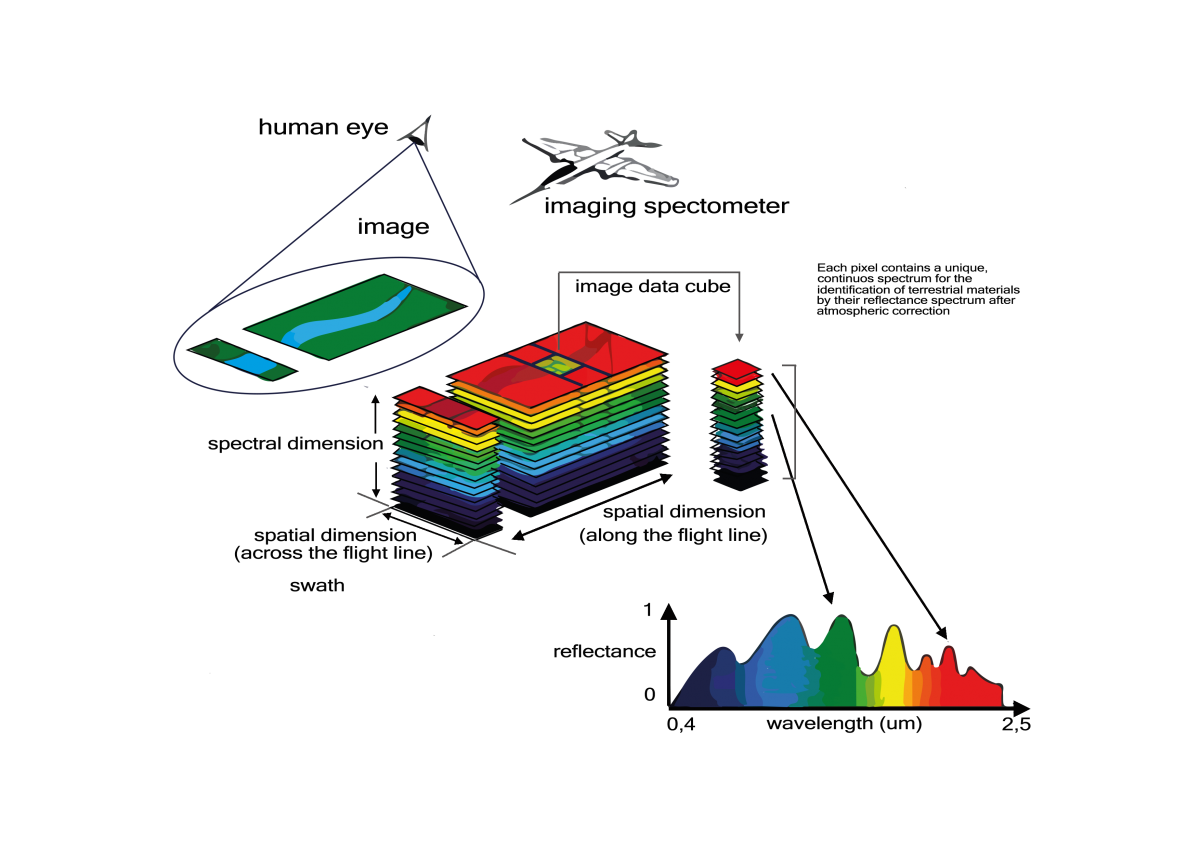
Imaging Spectroscopy Concept - Source: VITO - Flemish Institute for Technological Research
The amount of information is enormous and requires considerable more computing power than in the case of multispectral images.
The applications of imaging spectroscopy are manifold. The most important are geology (identification of minerals), precision farming, forestry (health status, identification of species) and management of aquatic environments (water quality, composition of phytoplankton).
Example: APEX (Airborne Prism Experiment), an airborne spectroradiometer developed for ESA as a calibration and validation device for future spaceborne hyperspectral imager. It offers hyperspectral information in 285 bands in a wavelength range between 400 and 2500 nm. The spectral sampling interval is less than 5 nm for the visible and infrared wavelengths and 10 nm for the mid infrared.
External links:
Hyperspectral Techniques
An Overview of Hyperspectral Remote sensing
USGS Spectroscopy Lab
Imaging Spectroscopy Resources on the Web
Spatial resolution
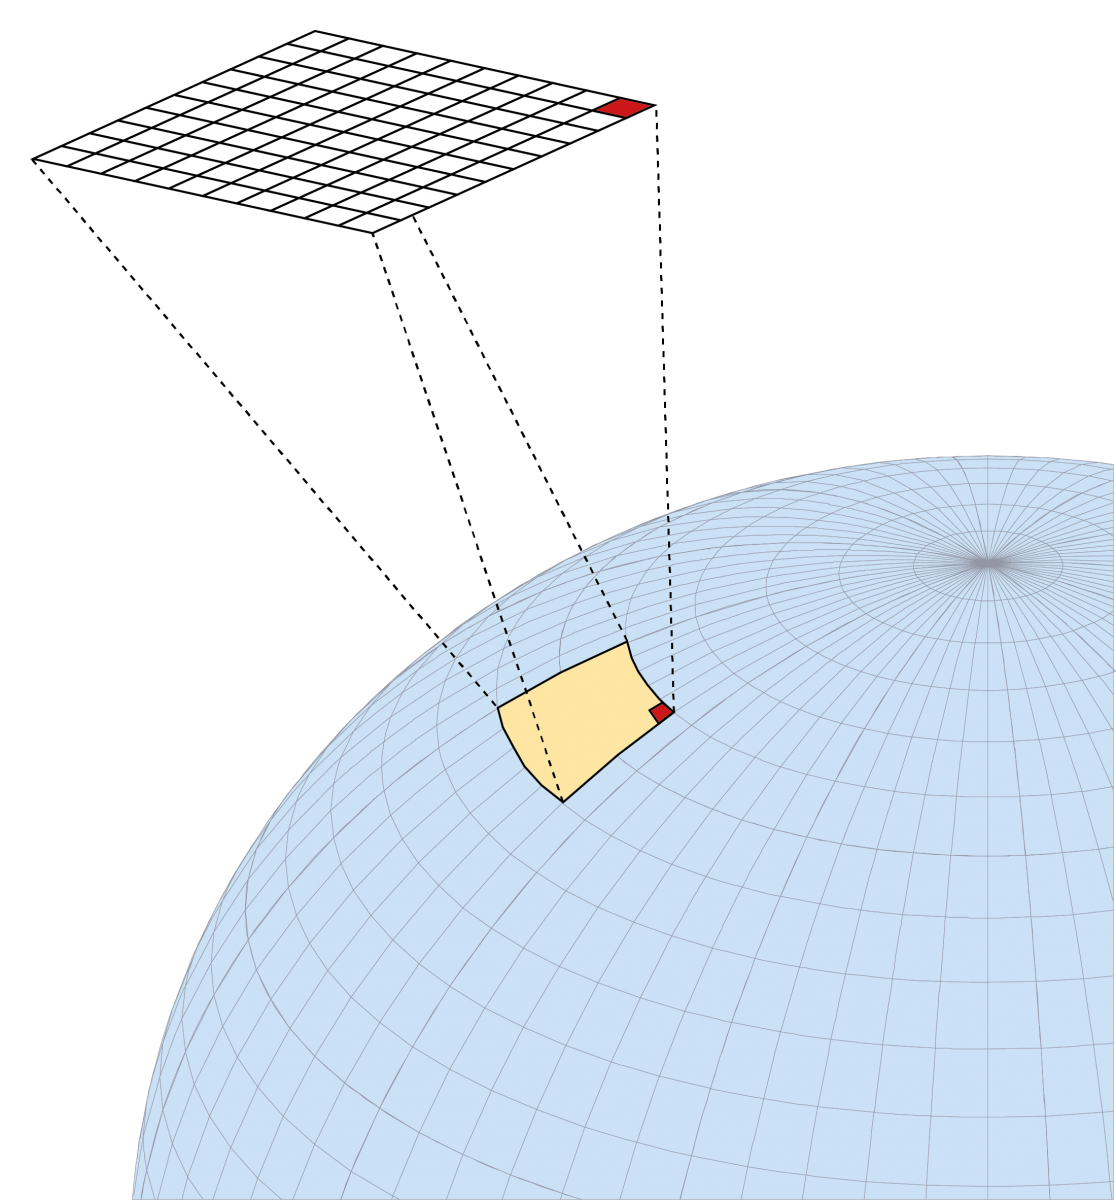 The number of pixels per millimetre defines a digital image's resolution. In remote sensing, the images’ resolutions are expressed by the size of the area covered by a pixel. Each pixel in an image corresponds to a patch on the Earth’s surface. We thus talk about ‘ground resolution’.
For example, each sensitive element of the SPOT 3 satellite’s high-resolution sensor’s CCD was only 13 µm (0.013 mm) across but ‘saw’ an approximately 10x10m area on the Earth’s surface through the observation system’s telescope. The sensor’s resolution is thus said to be 10m. Since this satellite’s CCD sensor consists of 6000 sensitive elements placed along a bar, the satellite sweeps a 6000 x 10m (= 60 km)-wide strip on the Earth’s surface as it orbits around the planet.
The resolutions of some Earth-observing satellites are given in this table:
| Satellite | Sensor | Ground resolution |
| Meteosat 11 | Seviri | 1 km |
| PROBA-V | VEGETATION | 100 m - 300 m |
| Landsat 8 | TIRS | 100 m |
| Landsat 4 | MSS | 80 m |
| Landsat 8 | OLI Multispectral | 30 m |
| Landsat 4 | Thematic Mapper | 30 m |
| SPOT 3 | HRV Multispectral | 20 m |
| Landsat 8 | OLI Panchromatic | 15 m |
| SPOT 3 | HRV Panchromatic | 10 m |
| SPOT 6&7 | Multispectral | 6 m |
| Pléiades | Multispectral | 2 m |
| SPOT 6&7 | Panchromatic | 1,5 m |
| Pléiades | Panchromatic | 0,70 m |
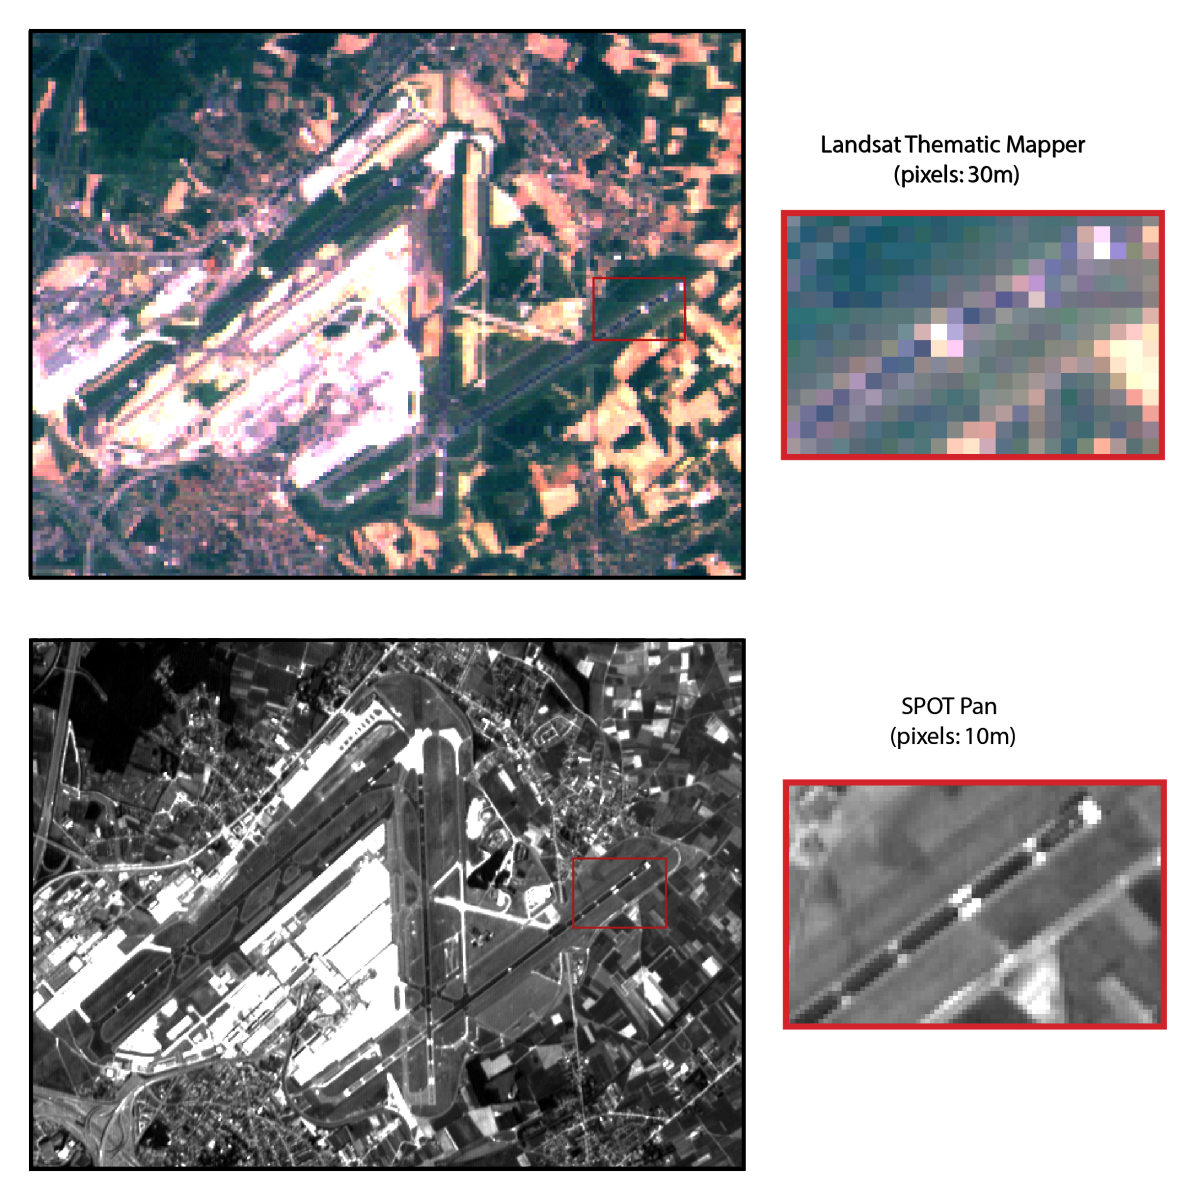
To show the importance of resolution for picture quality, here is a detail of an image taken by the US Landsat satellite’s Thematic Mapper sensor compared with the same area seen by the French SPOT satellite’s HRV sensor working in the panchromatic mode. Part of the image has been enlarged. The area covered is Brussels National Airport (Zaventem).