Image processing


Combination of images
Multitemporal analysis
... then the images change over time
One of the main advantages of satellite remote sensing is to be able to provide observations of the Earth at regular intervals. It thus becomes possible to compare a landscape in different seasons or follow longer-term developments. More than twenty years of library data from satellite readings of the Earth are currently available.
One of the simplest solutions for analysing data recorded on different dates is to display them simultaneously in side-by-side windows. Some image-processing and geographical information system software packages allow one to synchronise the two windows so that a movement or zoom in one of the windows will apply to the other window automatically. It is sometimes also possible to draw in a window (for example, the spread of a new housing development) and have the drawing appear in the two synchronised views.
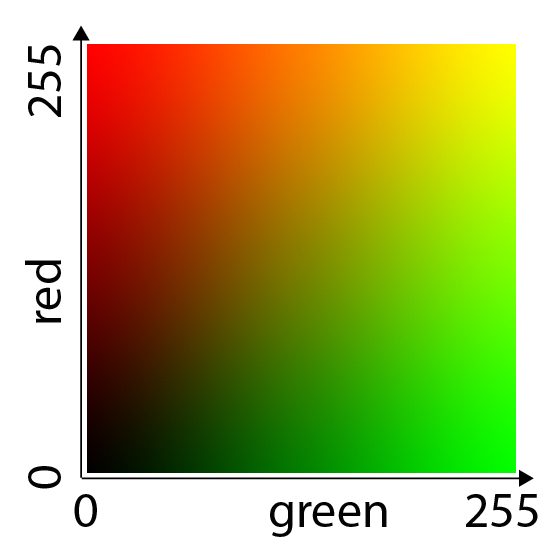
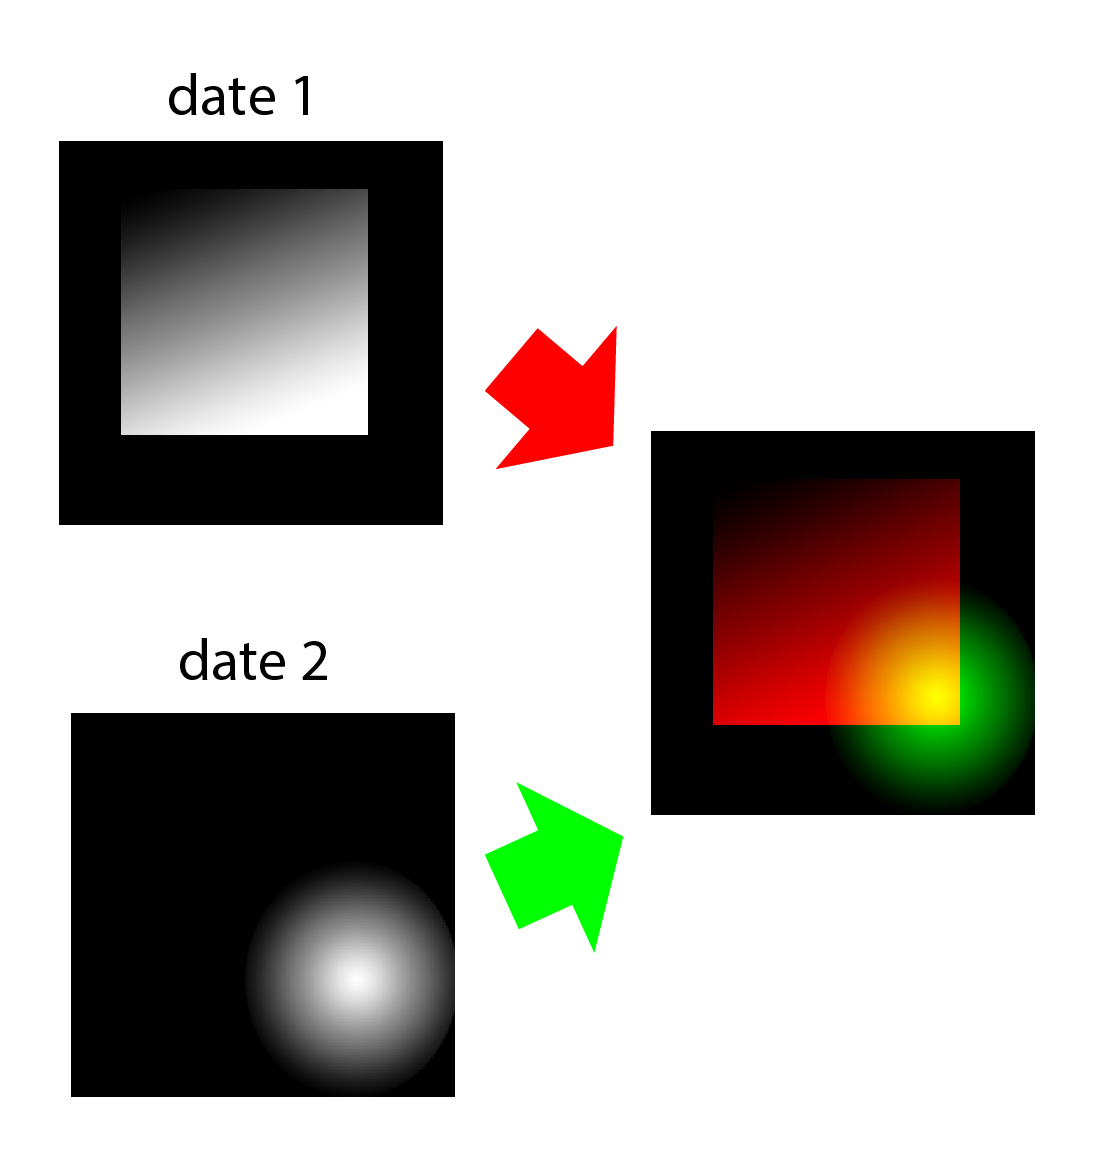
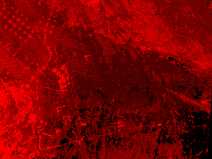
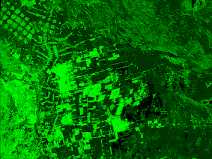
Another possibility for visualising multitemporal data relies on the additive synthesis of colours by the eye. The human eye interprets the superimposition of the primary colours (red, green, and blue) as new colours covering all the colours of the rainbow. If we superimpose an image acquired on one date and displayed in red on an image acquired on another date and displayed in green, the resulting image will contain colours ranging from black to yellow, with all the hues of green and red in between.
It is also possible to combine images taken on three different dates by including the blue component as well, but interpreting such images becomes more complex.
Of course, to be integrated into such a multitemporal image, each image must first be corrected geometrically with regard to a common reference.
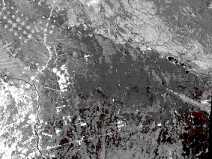
One interesting application of multitemporal processing is to calculate the vegetation index, as explained earlier, for two different dates. Merging the vegetation index images for two different dates will reveal seasonal changes, but also more radical changes, such as deforestation, etc.
| 1984 | 1994 | |||
|
|
|
|||
 |
 |
|||
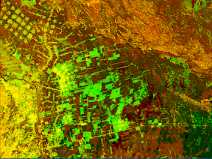 |
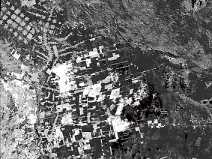
In this example, a multitemporal image was created on the basis of Landsat TM 1984 (in red) and 1994 (in green) images of Santa Cruz, Bolivia. The deforestation (in green) that occurred during this period is clearly visible.
Courtesy of NASA - Goddard Space Flight Center/Scientific Visualization Studio.
By combining several images, or rather several image products taken over a series of years, we can see not just the result of a certain phenomenon (in this case the total deforested area) but also its evolution throughout time (the yearly deforestation rate).
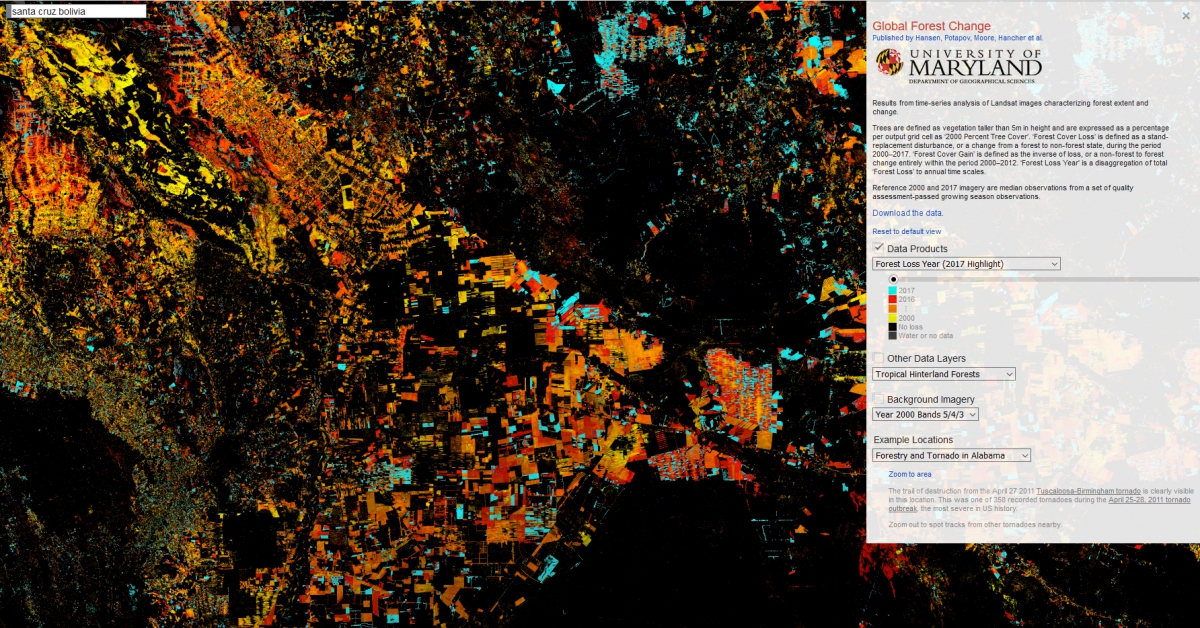
Source: Global Forest Change - Results from time-series analysis of Landsat images characterizing forest extent and change.
Merging images with different resolution
Mergers and resolutions
The images acquired by the various sensors of Earth observation systems have different characteristics, especially with regard to the number of spectral bands and resolution (pixel size). As a rule, these two parameters are mutually exclusive: the images that offer the best resolution have only one spectral band and multispectral data are available only in relatively crude resolutions. Yet for some applications it would be useful to have the best of two worlds, that is, fine resolution AND multispectral data.
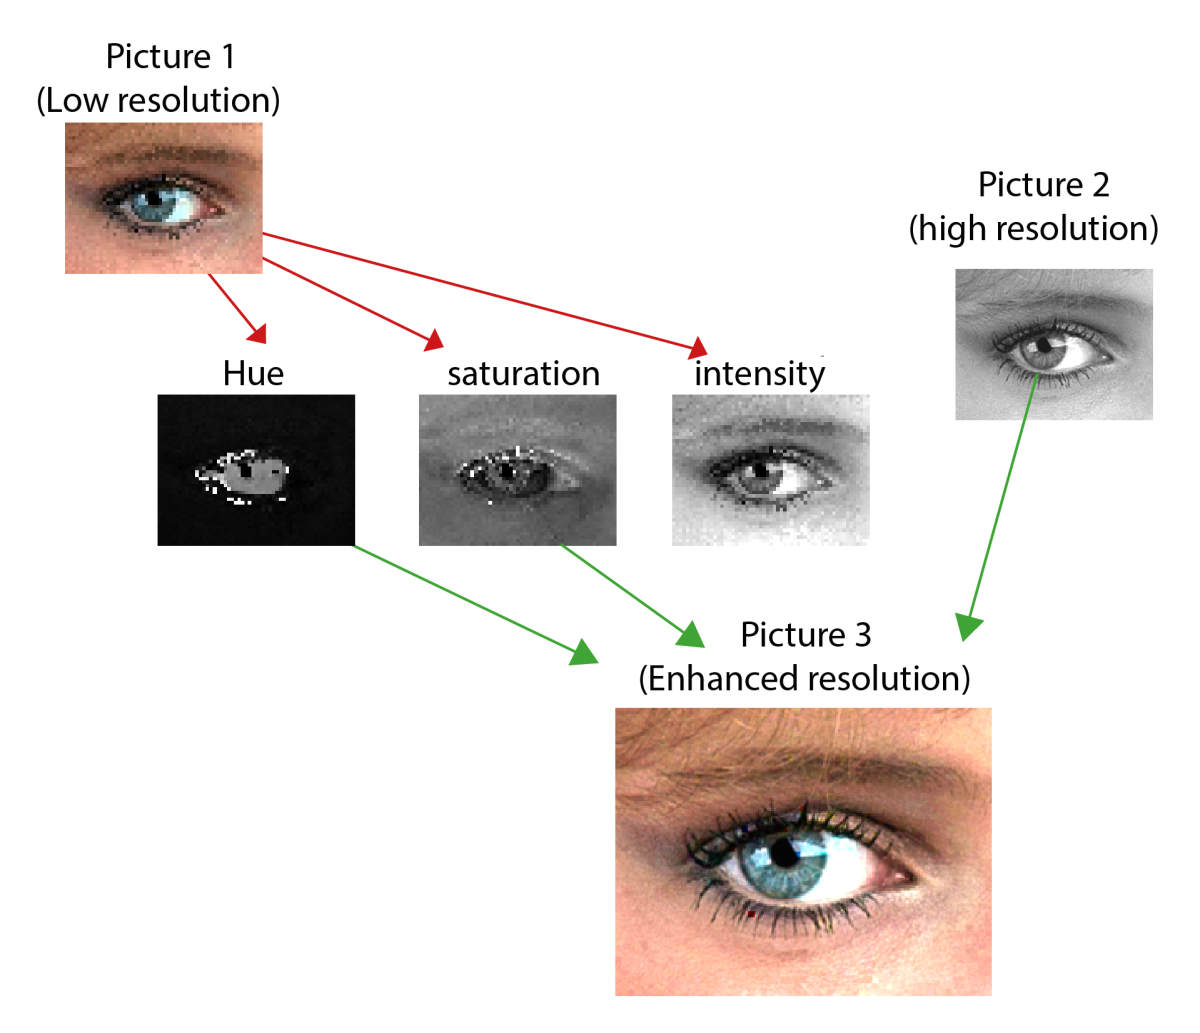
If a low-resolution multispectral image and a high-resolution monospectral image of the same area are available, they can be merged to create an image combining all of their respective advantages. This is done by breaking down the multispectral image (the colour image in the illustration) into three components (hue, saturation, and value or intensity) describing its colour content. This is called the ‘RGB to HSV’ (red, green blue to hue, saturation and value) transformation. These components are corrected geometrically to have the same geometric properties as the high-resolution image. For example, each pixel of a TM image (30x30m) is subdivided into 9 10x10m pixels. to be compatible with the resolution of a SPOT P image. The low-resolution image’s intensity component is then replaced by the high-resolution image and the reverse transformation (‘HSV_to_RGB’ algorithm) is performed.
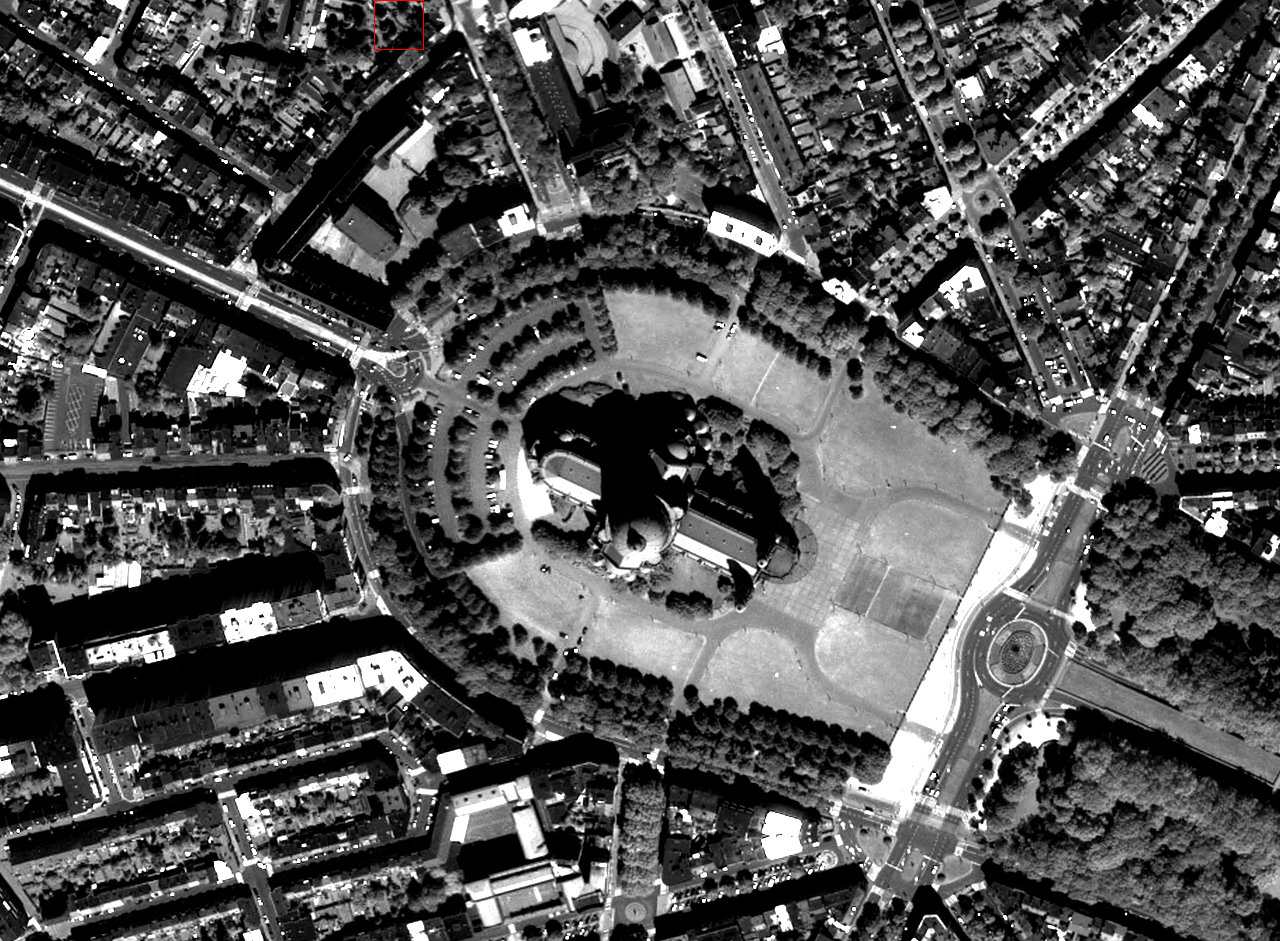
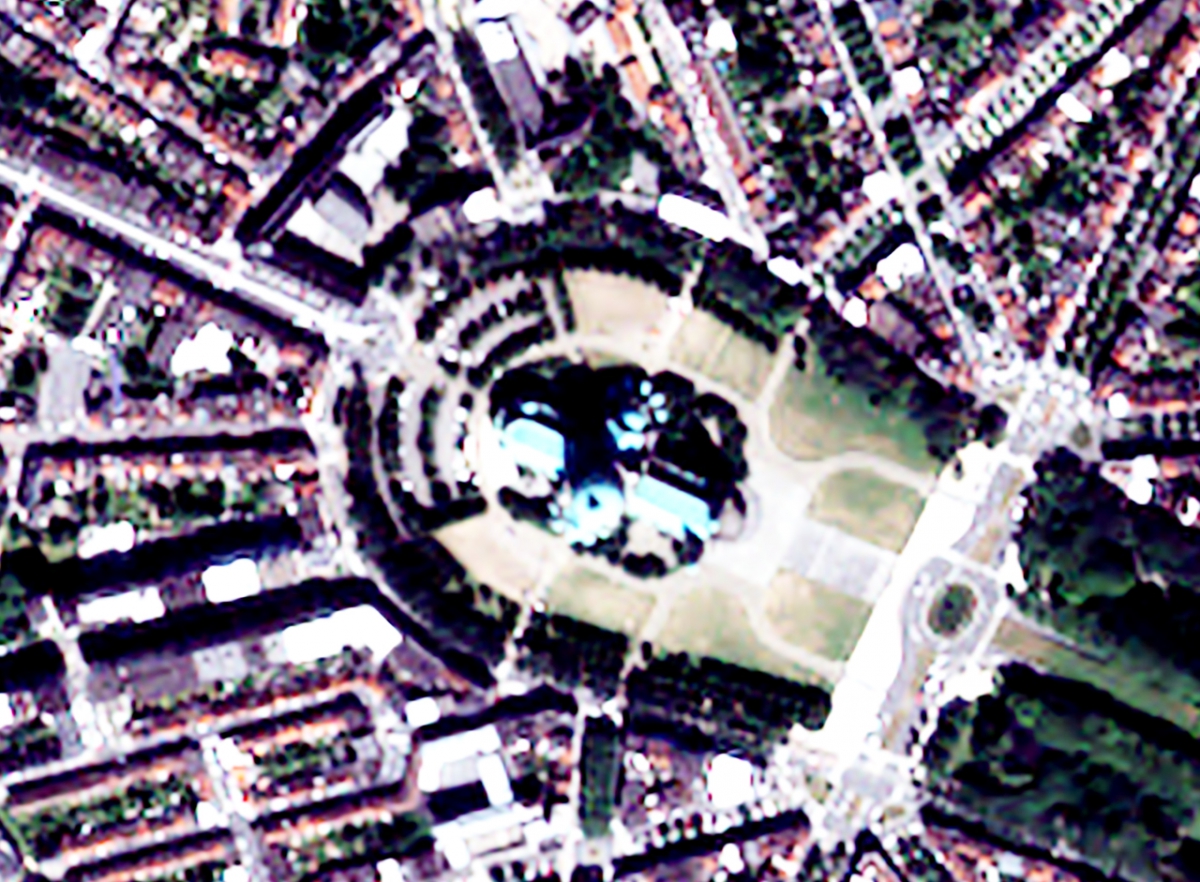
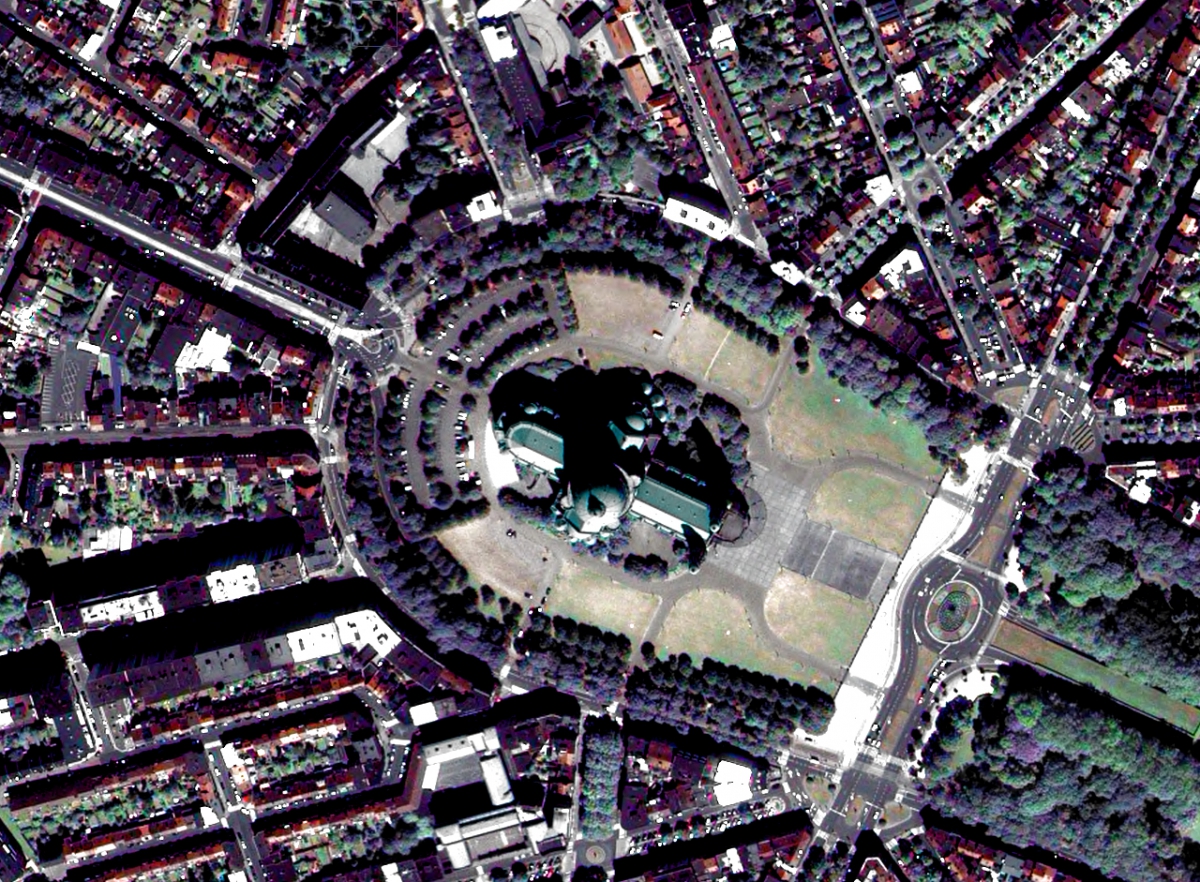
This technique’s application to satellite images is illustrated below, where the multispectral (XS mode, 2m resolution) and panchromatic (P mode, 50 cm resolution) images of the Koekelberg Basilica in Brussels by a Pléiades satellite have been merged to create a multispectral image with a 50 cm resolution.
|
|
|
Panchromatic image 50cm |
Multispectral image 2m |
 |
|
Multispectral image 50 cm |
|