III - WHAT IS A DIGITAL IMAGE?
2- CHARACTERISTICS OF AN IMAGE
2.1- Spectral resolution
Depending on their technical characteristics, sensors on board satellites can record radiation reflected or emitted by objects on the ground in different wavelength intervals.
Spectral resolution is the sensor's ability to distinguish electromagnetic radiation of different frequencies. The more sensitive the sensor is to fine spectral differences (narrow wavelength intervals), the higher the sensor's spectral resolution. Spectral resolution depends on the optical filtering device that breaks down the captured energy into a larger or a smaller number of spectral bands that are more or less wide.
High spectral resolution is needed, for example, if we want to distinguish types of agricultural cultures whose spectral signatures are quite close.
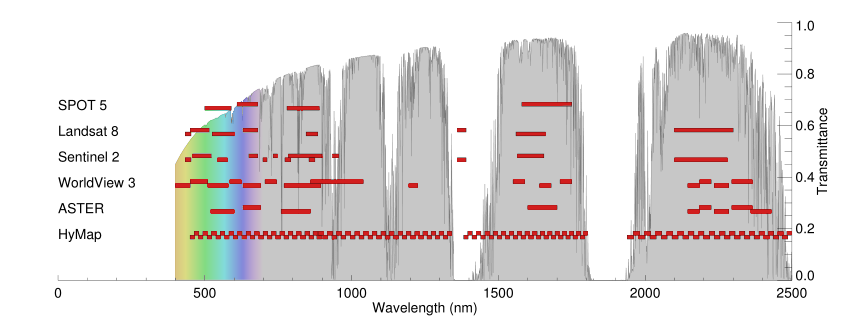
Spectral bandwidths of the SPOT-5, Landsat-8, Sentinel-2, Worldview 3, ASTER and HyMAP sensors. Atmospheric transmission is shown on the Y-axis. Source: Van der Werff, H.; Van der Meer, F. Sentinel-2 for Mapping Iron Absorption Feature Parameters. Remote Sens. 2015, 7, 12635-12653. https://doi.org/10.3390/rs71012635
In optical remote sensing, we generally distinguish three main types of imaging based on spectral resolution: panchromatic, multispectral and hyperspectral imaging..
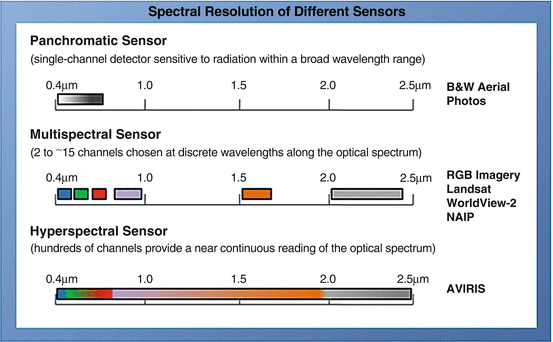
Source: Vegetation Analysis: Using Vegetation Indices in ENVI - ©2023 NV5 Geospatial Solutions, Inc.
Panchromatic imaging
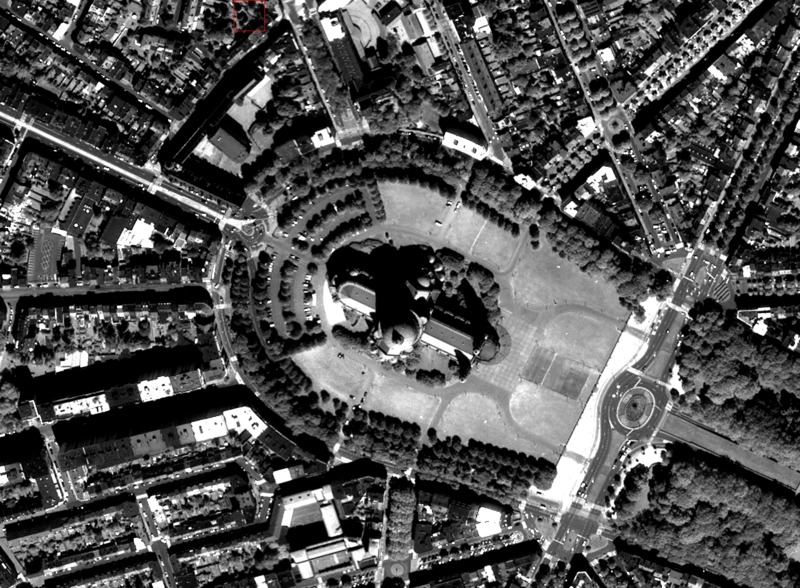
In remote sensing, black-and-white images are also used. These are images obtained from recording in a single wavelength region in visible light, i.e. between 0.4 and 0.7 µm. They only provide information about the intensity of radiation in this wavelength region, without distinguishing frequencies (and therefore colours). Since the data is collected only in one channel, only one value is assigned to each pixel. If the image is encoded at 8 bits, it will be seen in 256 (28) grey levels.
These images are called panchromatic images (literally, "all colours"). The advantage is that due to the wider spectral range, more energy ends up at the photocells, which allows the field of view (IFOV - see Spatial resolution) to be made smaller, resulting in more spatial detail. In other words, small changes in brightness can be detected because each pixel captures a large proportion of the Sun's radiation.
Panchromatic and multispectral images are often merged using a technique called "pansharpening" to increase the spatial resolution of multispectral images.
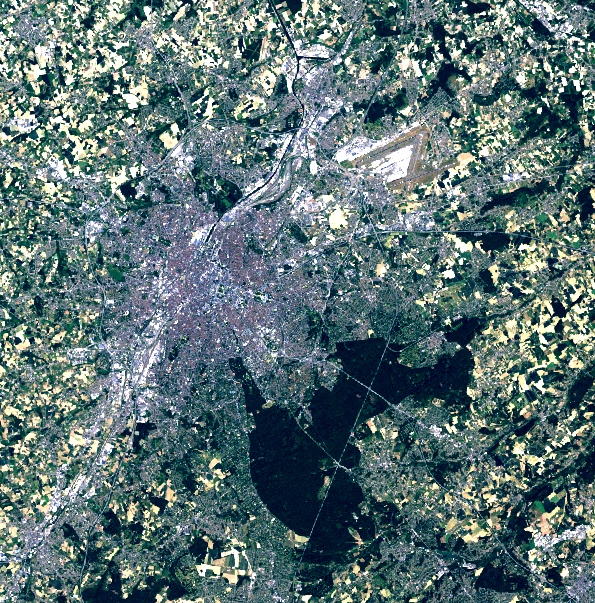
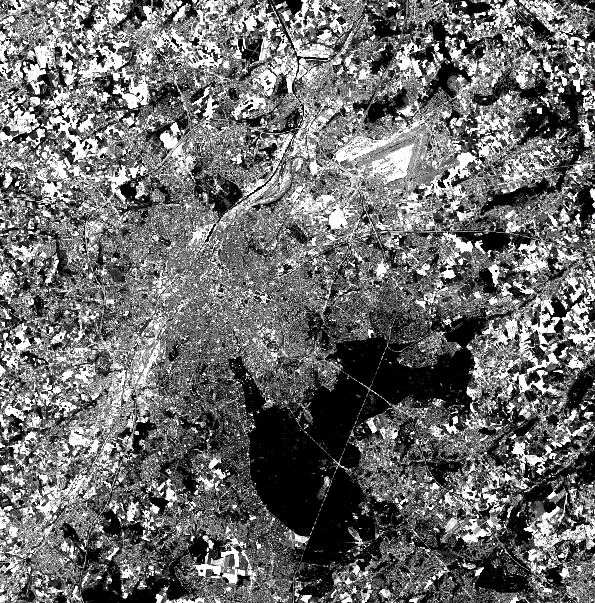
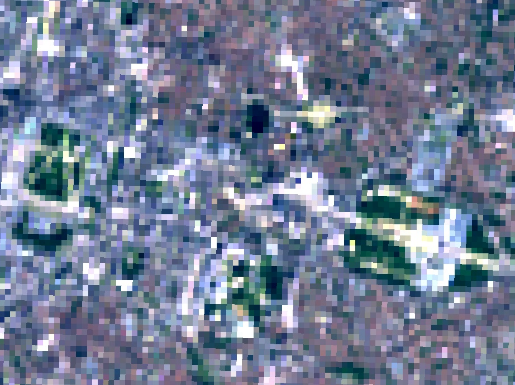
Below is an example of this type of image fusion.
 |
 |
 |
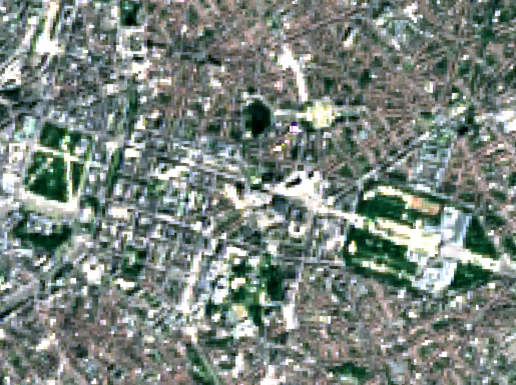 |
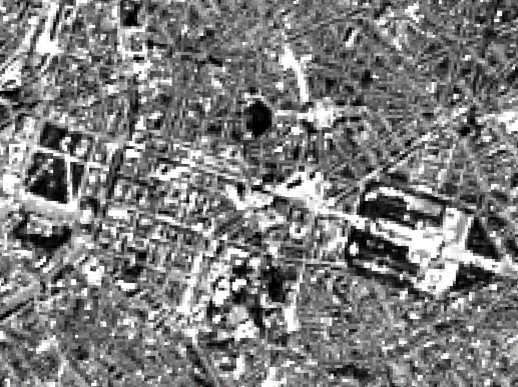
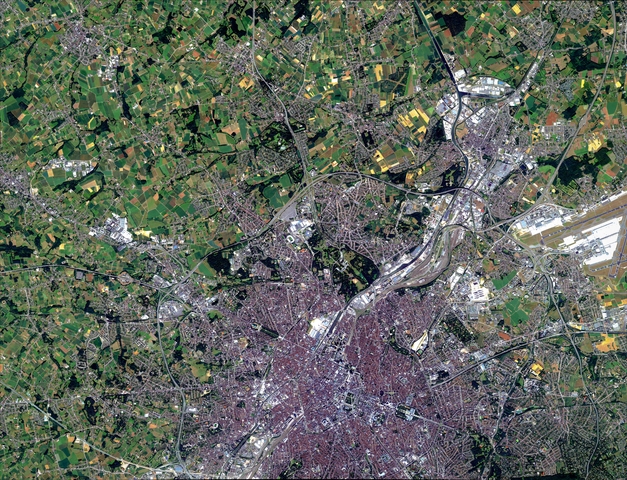
Landsat-8 image of Brussels taken on 28 May 2020. True colour image top left and panchromatic image top right. The three images below show a detail of the Parc de Warande and Parc du Cinquantenaire: panchromatic image (left), true-colour image (centre) and pan-sharpened image (right). The multispectral image data used to create the true-colour composite has a spatial resolution of 30m per pixel. The panchromatic image has a spatial resolution of 10m per pixel and therefore looks much sharper on the more detailed images below. Pansharpening techniques allow us to link the spectral information from the multispectral images to the pixels of the spatially more detailed pan-image.
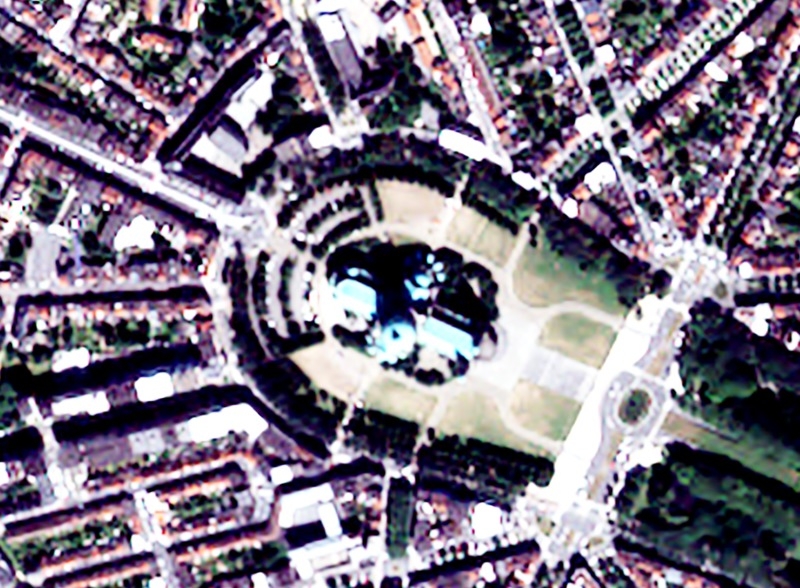
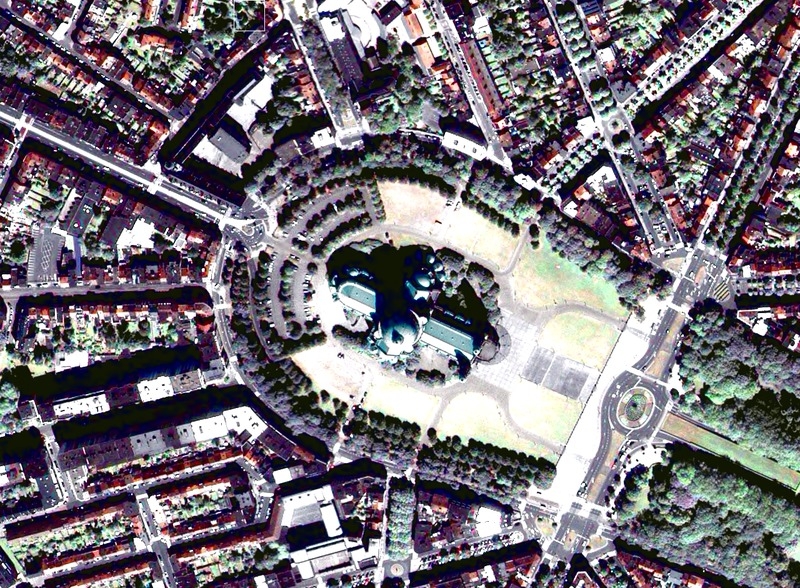
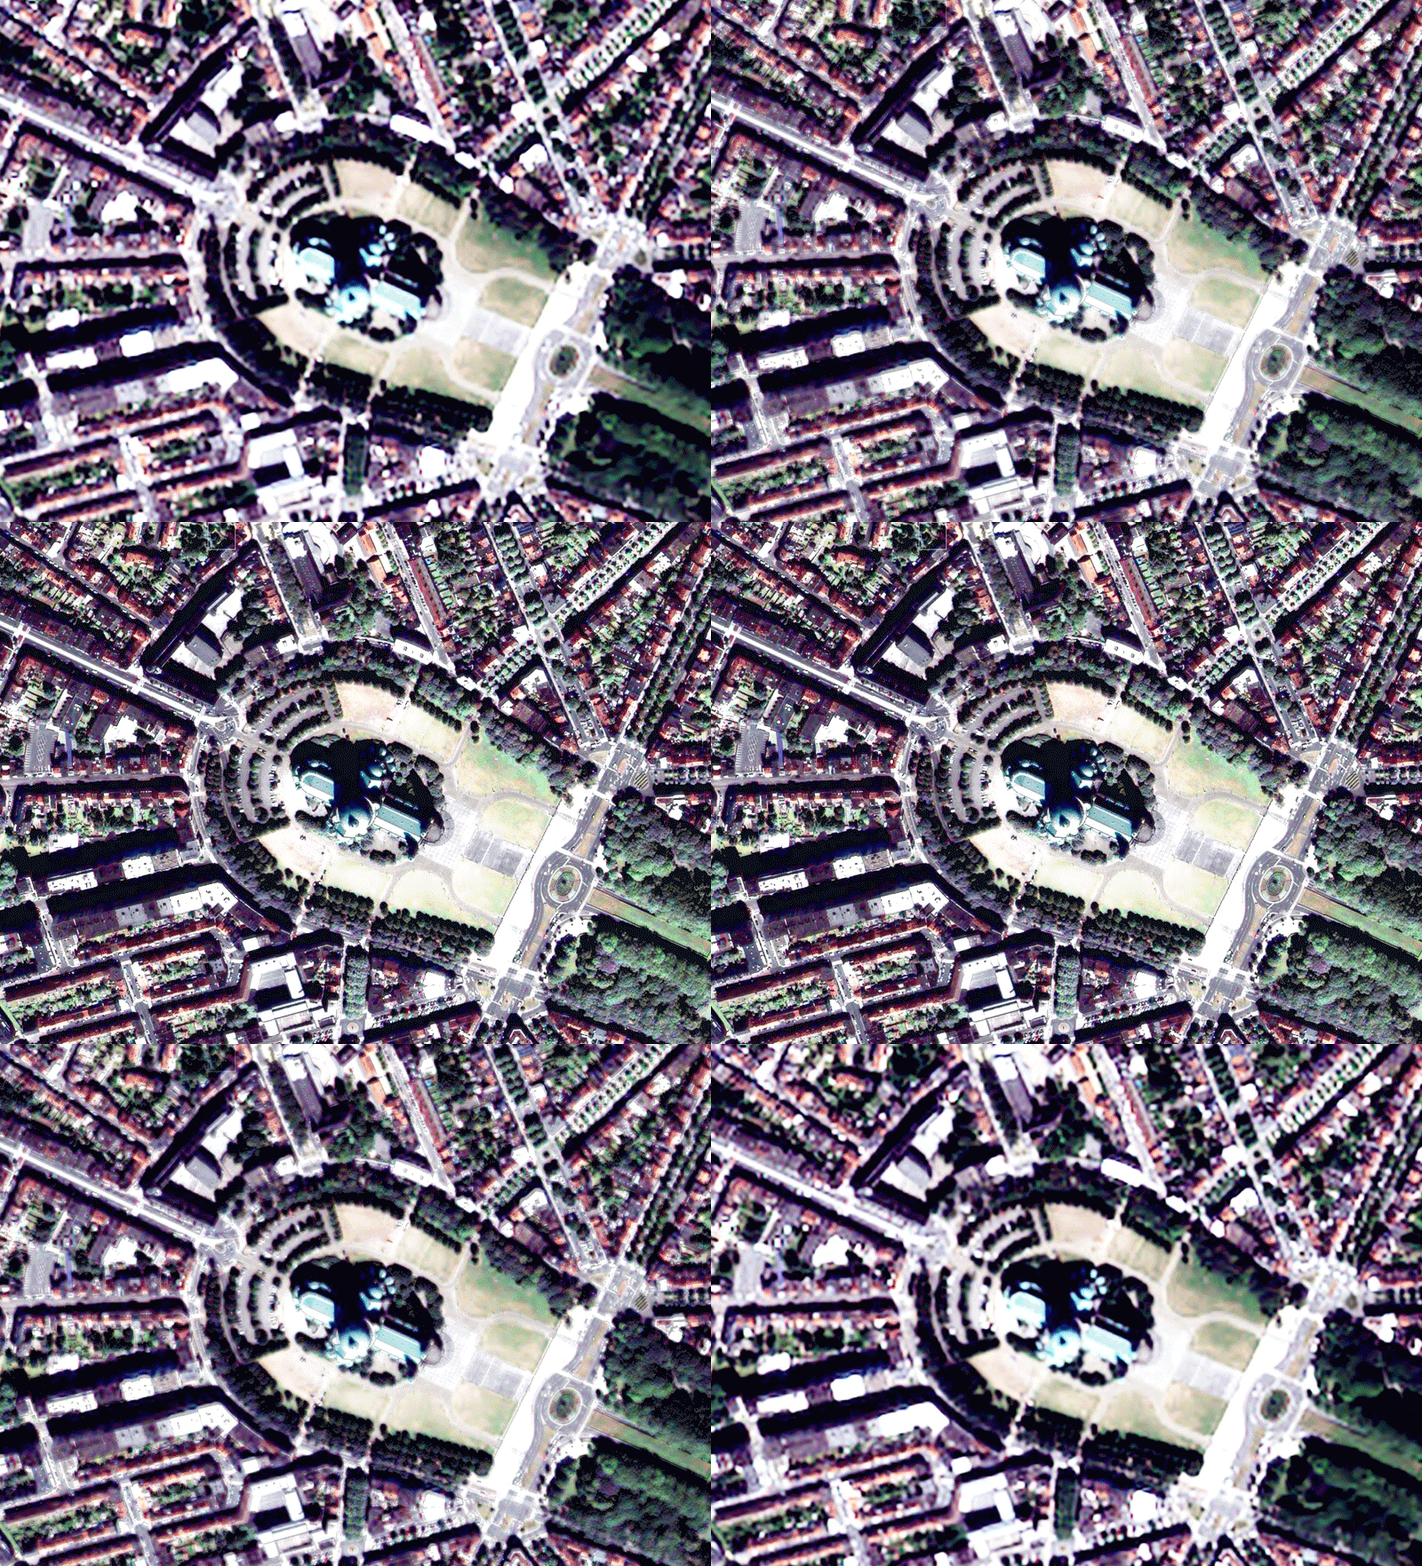
Another example is illustrated by the Pleiades image gallery below, which contains the following:
- A multispectral image of Brussels at 2 m resolution;
- An extract of this multispectral image centred on the Koekelberg Basilica;
- An extract of a 50-cm resolution panchromatic image centred around the Basilica of Koekelberg;
- A merged ("pansharpened") image of the Basilica of Koekelberg with a resolution of 50 cm.
The animation below shows the effect of sharpening:
Multispectral imaging
Multispectral data are obtained by simultaneous recordings in a relatively small number of spectral bands (3 to 15), which are usually discontinuous. Each band comprises intervals of different wavelengths ranging from visible light to infrared light. Recordings in different spectral bands can be combined to create colour images.
The data of each band is represented as one of the primary colours, and depending on the relative brightness (i.e. numerical value) of each pixel in each band, this colour is represented in a specific grey value (hue). Combining the pixels of the three bands in the three primary colours (red, green, blue) - each in their shades based on the numerical value in the respective band - one obtains a colour image.
Depending on the bands used, the colours displayed may or may not correspond to the true colours; similarly, false colour composites (see True and false colour composites) can be created.
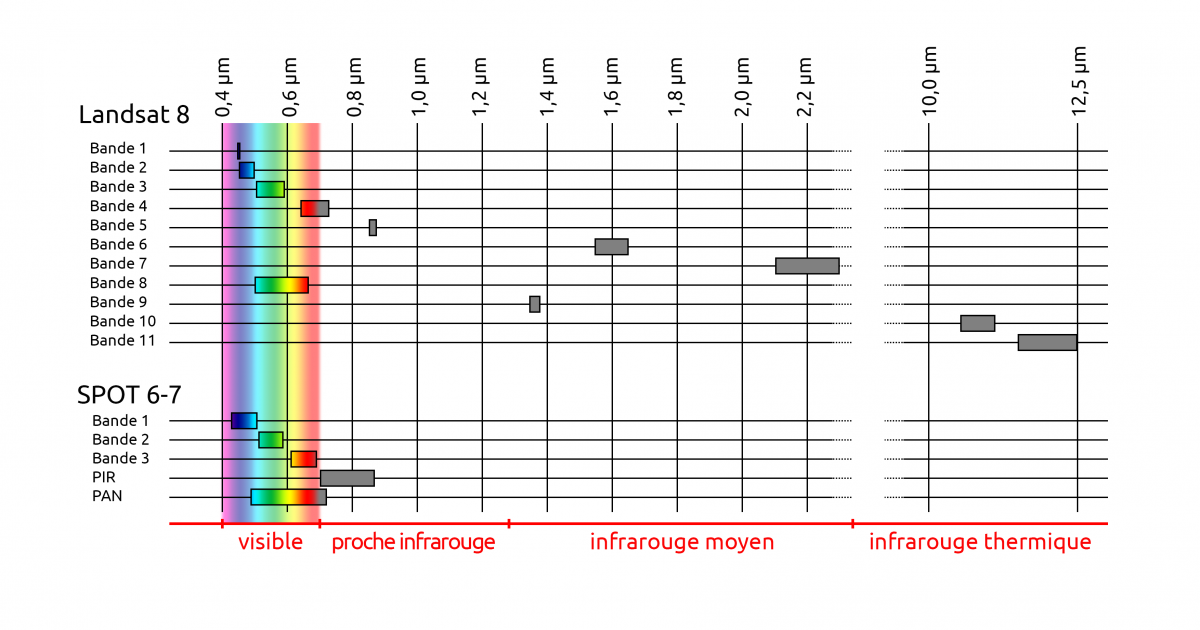
For instance, the OLI (Operational Land Imager) sensor on board the Landsat 8 satellite takes images in 8 bands in multispectral mode, with wavelengths between 0.43 and 2.29 µm (4 in the visible spectrum, 1 in the near-infrared, 3 in the mid-infrared) and 1 band in panchromatic mode. The TIRS sensor (Thermal InfraRed Sensor) records in 2 bands in the thermal infrared.
The NAOMI sensor from satellites Spot 6 and 7 generates four spectral bands in multispectral mode:
- the blue band records the part of the spectrum ranging from 0.450 to 0.52 µm,
- the green band from 0.53 to 0.59 µm,
- the red band from 0.625 to 0.695 µm
- the near-infrared band (NIR) from 0.76 to 0.89 µm,
and a single band in panchromatic mode (0.45 - 0.745 µm ).
Hyperspectral imaging
Hyperspectral images are produced by sensors capable of capturing information in a multitude of spectral bands (often more than 200), each only a few nm wide. Usually, these are contiguous bands in the visible, near-infrared and mid-infrared parts of the electromagnetic spectrum.
Hyperspectral data therefore provide more detailed information about the spectral properties of a scene. The spectral signature of objects is more precise and so it is possible to distinguish and identify objects more accurately (e.g. different rocks, types of ground cover, water quality, etc.) than what can be done with broadband sensors.
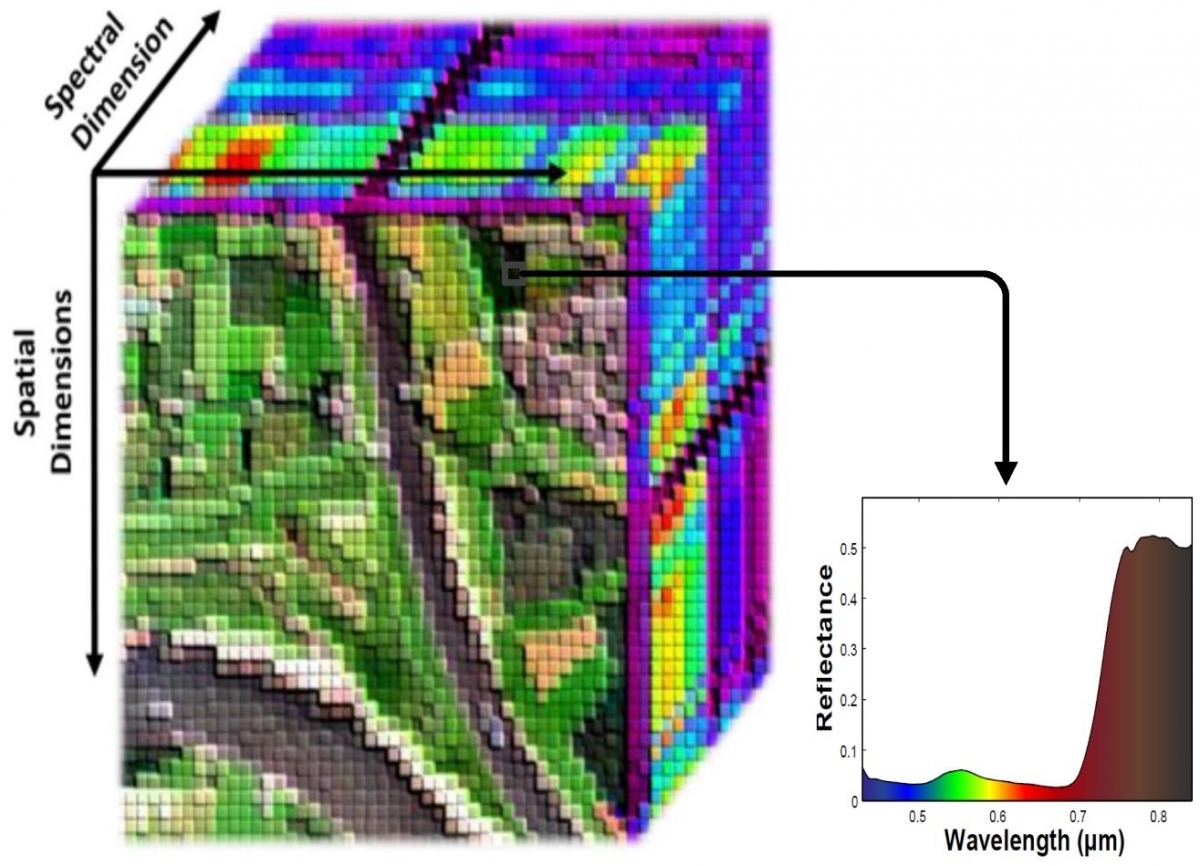
Each pixel in a hyperspectral image contains the information collected in a large number of wavelength intervals spread across the entire visible and infrared spectrum. The amount of information to be stored and processed is therefore huge and requires much greater computing power than in the case of multispectral images, This can be a limitation for large-area data processing.
Source: Rasti B. et al. (2018). Noise Reduction in Hyperspectral Imagery: Overview and Application. Remote Sensing. 10. 482.
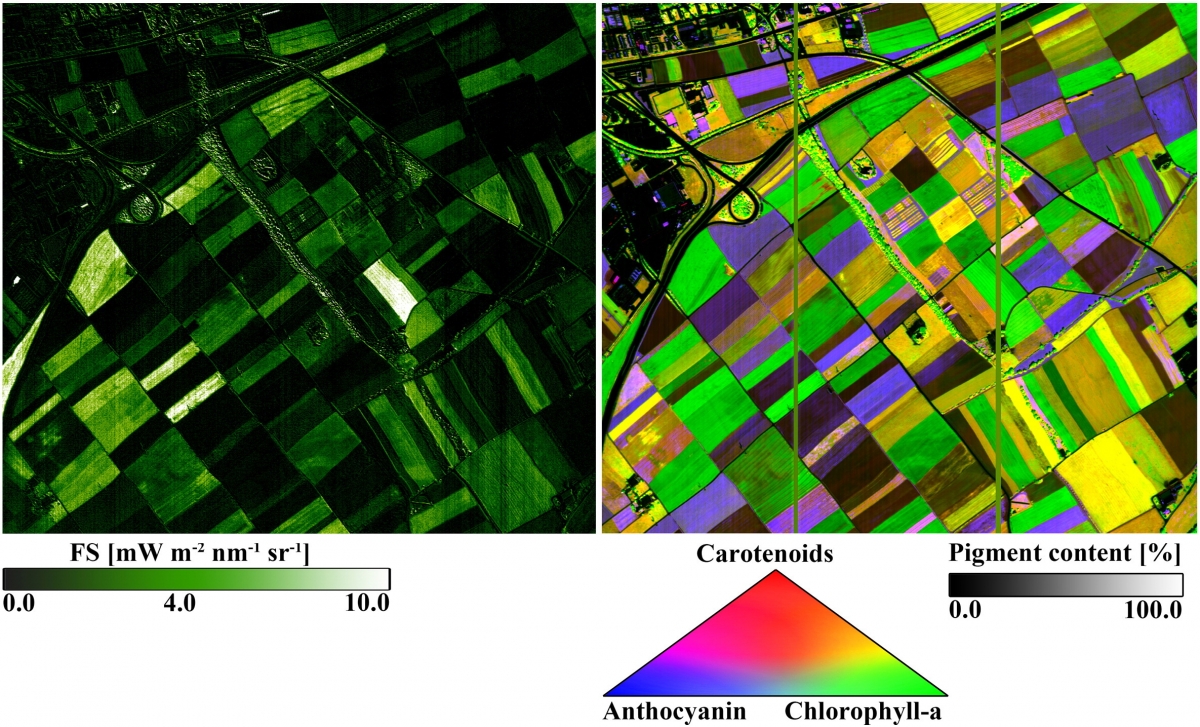
The applications of hyperspectral imaging are multiple. Major applications are these in geology (identification of minerals ...), but people also use them in precision agriculture, forestry (health status of forest resources, species identification ...) or management of aquatic environments (water quality, phytoplankton composition ...)
|
The Airborne Prism Experiment (APEX) is an imaging spectrometer developed for ESA as an instrument for the calibration and validation of a future hyperspectral satellite sensor. APEX has a beam splitter that splits the radiation into visible and infrared light (VNIR: 0.380 - 0.970 µm) on the one hand and short-wave infrared (SWIR: 0.940 - 2.5 µm) on the other. The sensor features an adjustable number of spectral bands of up to 334 in VNIR (nominally 114) and 198 in SWIR with a spectral resolution of 0.6 - 6.3 nm and 7.0 - 13.5 nm, respectively. Source: eoPortal
|
Spectral resolution and radar images
Radar images are often considered monochrome. This is not quite correct. If we want to increase spatial resolution in the sensor's direction of motion, we build a very large linear antenna step by step. To increase the resolution transverse to the direction of motion, we use a coded signal so that we can measure the travel time of the signal with very high precision.
This encoding is done in frequency. Therefore, the signal used is not 100% monochrome, but has a relatively narrow bandwidth around a carrier frequency.
The latest radars use an increasingly wider spectral band to increase spatial resolution in distance.


