

IV - FROM DATA TO INFORMATION
2- HOW CAN WE IMPROVE THE RENDERING OF AN IMAGE?
The appearance of images can be enhanced to facilitate their interpretation and analysis. This can be done by selecting the most interesting parts of the raw data, by judiciously combining different channels or by placing an image on a map.
2.1- Improving contrast
Most digital image display systems can distinguish 256 (8 bits so 28) intensity levels per "fundamental" colour (red, green, blue). With these 24 bits per pixel, a rounded 16.8 million different colours (2563) can be displayed.
|
The human eye normally has three types of cone cells that are sensitive to different wavelength ranges. Each of these cells can register about 100 hues, allowing us to perceive about 1 million different colours (1003). |
An image that fully utilises that range (i.e. with coded values between 0 and 255 for each channel) has excellent contrast. In contrast, if only a limited range of values is used, the image is more likely to have poor contrast. We can visualise the contrast as a graph, namely with a frequency histogram of the pixel values.
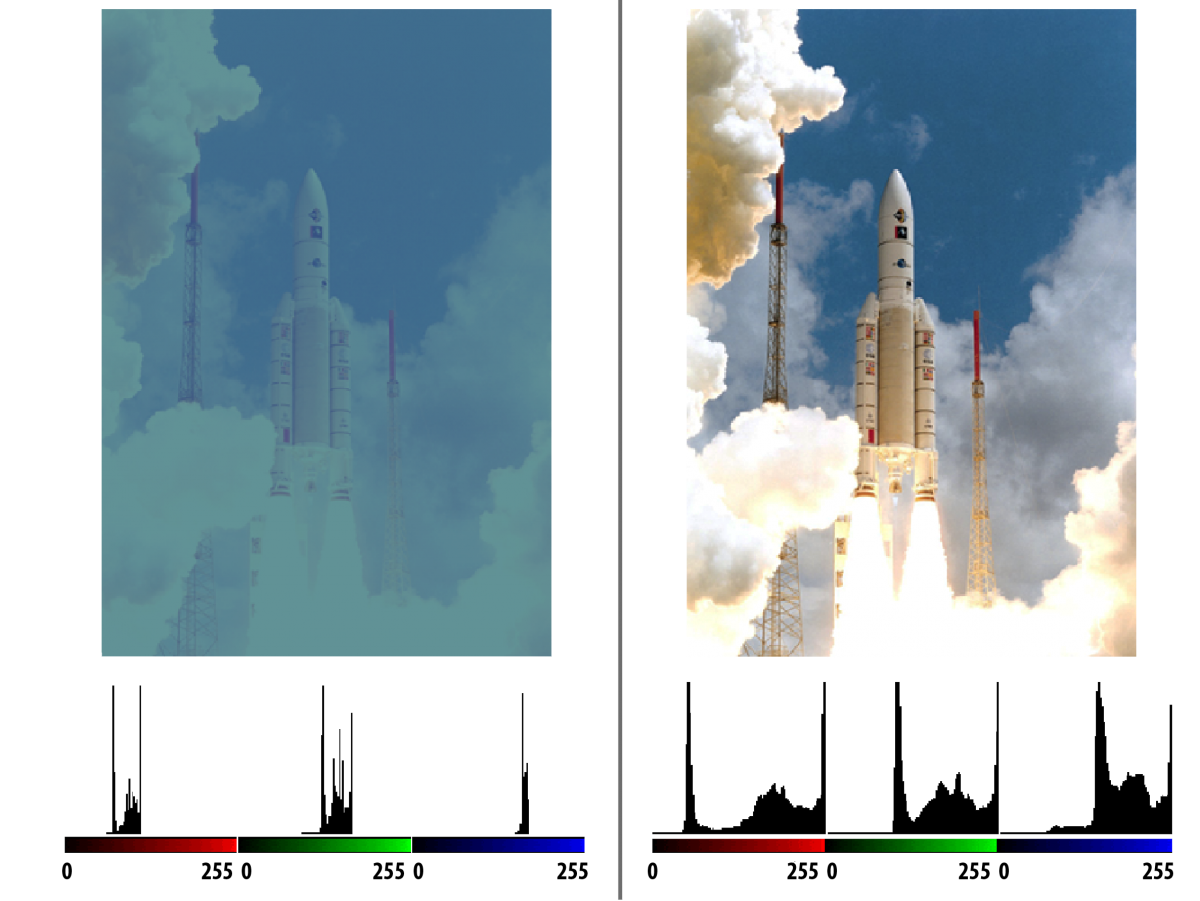
The image on the left has low contrast. The histograms at the bottom of the image show that the pixel values have only a very narrow range of values in the red and green spectral bands and certainly in the blue band. The histograms also show that high (and therefore bright) values are more prevalent in the blue and green bands than in the red band, where there are more lower and therefore darker values. This explains why the left image looks green-blue. A function to stretch the contrast (eng. contrast stretching) was applied to the image on the right. The numerical values of the original image were modified according to a linear function specific to each of the 3 RGB components to exploit all possible values between 0 and 255.
The sensors of earth observation satellites are calibrated to record very different light conditions: from very dark areas (e.g. equatorial forests and oceans) to highly reflective areas (e.g. deserts or ice floes). Because areas containing these two extremes are rather rare, earth observation images usually have a narrow range of numerical values and therefore also have low contrast.
To improve contrast, we can extend the utilised value range for each band. To do this, for example, we assign the value 0 to the minimum value of our spectral band and the value 255 to the maximum value. All values are then redistributed between these two extremes. We could do this with a simple linear rescaling, but there are other possibilities based on the scatter function (e.g. with the standard deviation) or by setting a threshold that excludes extreme values.