

IV - FROM DATA TO INFORMATION
2- HOW CAN WE IMPROVE THE RENDERING OF AN IMAGE?
2.3- Satellite maps
Aerial photographs or satellite images are often used for map production, especially to determine the nature and position of the objects to be fitted on the maps. Although remote sensing data are used, the images themselves were usually not visible on the maps.
Nowadays, earth observation images are increasingly used directly as base maps. To do so, the satellite image is first geometrically corrected and fitted into a cartographic reference system (see Geometric and topographic correction). It is then possibly processed to obtain an image that is easier to interpret (see Contrast enhancement and True and false colour composites), to highlight desired information (see Pan-sharpening and Spectral ratios) or to add thematic information (e.g. image classification, see Image analysis and classification). Finally, labels are added to make the interpretation of the map document easier (e.g. name of towns and villages, contour lines, etc.). Of course, a scale and legend should not be missing either.
Once the base map is finished, geographical data in vector format can be added to it. The image then actually acts as a background on which relevant geographical data is displayed. Maps made from satellite images are an ideal solution for hard-to-reach areas for which we need to develop small- and medium-scale maps quickly and up-to-date.
An interesting application of this is so-called emergency mapping. If a (natural) disaster occurs, satellite images are a valuable data source for organising aid, facilitating reconstruction operations or estimating damage.

On 25 January 2019, a dam collapsed southeast of the Brazilian town of Brumadinho, operated by the largest mining company in the country. A river of mud containing mining waste flooded the mine site and several downstream villages, resulting in at least 166 fatalities. The geospatial map above shows the extent of the mudslide two days after the disaster, as well as the location of buildings likely to be affected. The reference image used is a Sentinel-2A image with 10m resolution recorded on 22/01/2019, and the post-event image is a RapidEye image with 5m resolution recorded on 27/01/2019. Source: Dam Collapse in Brumadinho, Brazil (International Charter Space and Major Disasters) -Copyright: © Planet (2019) - All rights reserved -Map produced by CENAD
Therefore, in 2000, several space agencies signed the international charter "Space and Major Disasters", making satellite data available free of charge to facilitate major disaster management.
Since 2012, the European Copernicus Emergency Management Service (EMS) has also been using satellite imagery and other geospatial data to provide a free map service worldwide in the event of a natural disaster, man-made emergency or humanitarian crisis.
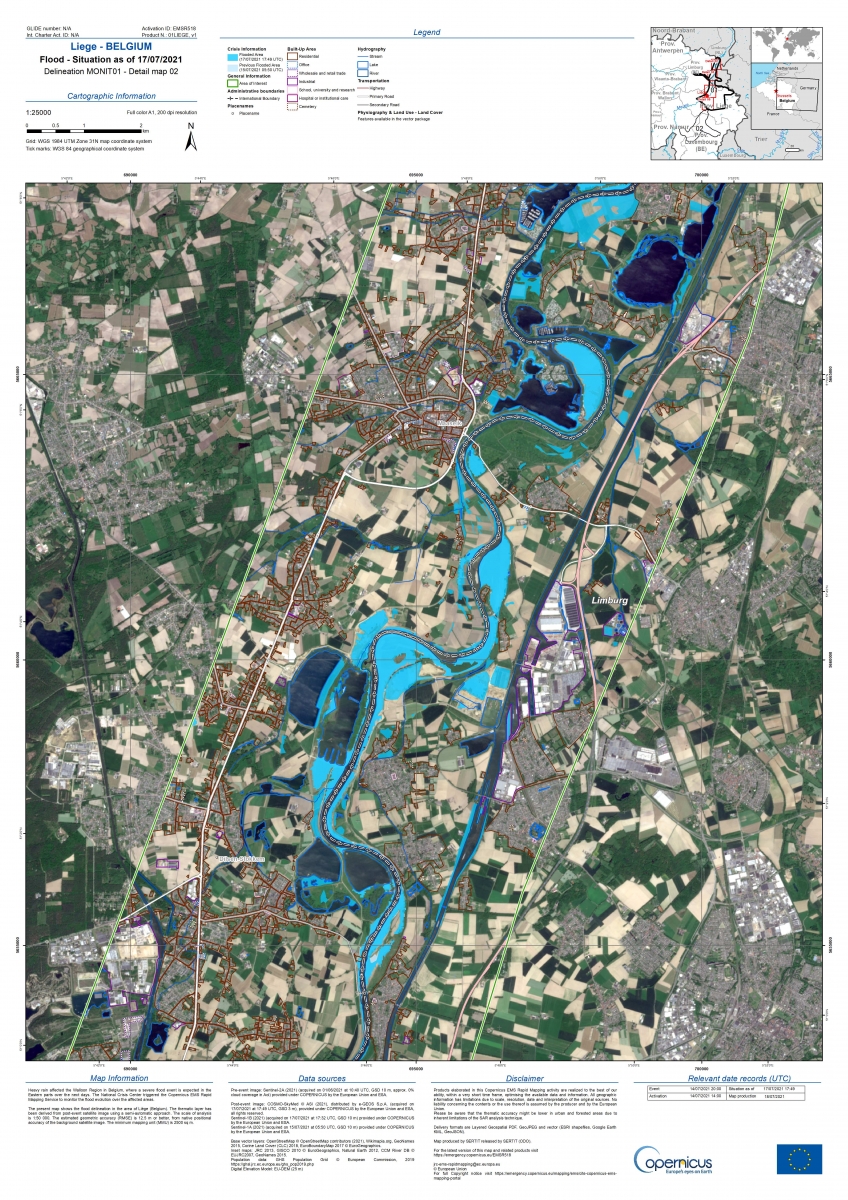
In July 2021, heavy rainfall caused severe flooding in the eastern Walloon region. The National Crisis Centre activated the Copernicus EMS rapid mapping service to monitor flooding in the affected areas. The impact map above shows the extent of flooding in the Liège region on 17 July 202. The reference image is a 10m resolution Sentinel-2A image of 01/06/2021 and the images used after the flooding are COSMO-SkyMed images (at 3m resolution) and Sentinel-1B images (at 10m resolution) of 17/07/2021 and a Sentinel-1 A image of 15/07/2021). Source : Copernicus Emergency Management Service (© 2021 European Union),[EMSR518] Liege: Delineation Product, Monitoring 1, version 1, release 1, RTP Map #02.
Emergency mapping converts raw spatial data into relevant geographical information that can be used immediately by crisis management agencies or rescue teams deployed to the scene. This mapping is based on the comparison of a reference state, before the event, with the state observed during the event or immediately afterwards, both observations being obtained using Earth observation satellites.
After geometrically correcting the images and projecting them into a common reference system, the delineation of affected areas is performed digitally using change detection algorithms. The final product, a geospatial map, is obtained by overlaying the affected area over a cartographic reference background, which may itself be a satellite image in true or false colours.
The "satellite maps" obtained may be maps that serve to locate the disaster, reflect its geographical extent or intensity or estimate its impact.
